
Figure 4.
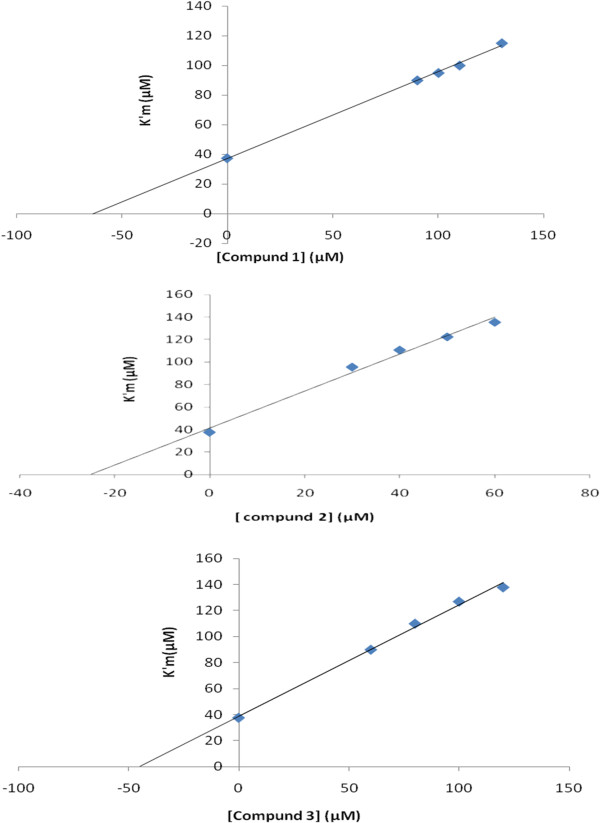
Secondary plot, K′m versus three novel inhibitors in the range of 0–130 μM and in different concentration of substrate 20–124 μM. All experiments performed in 37°C and phosphate buffer, pH=7.5.
Official websites use .gov
A
.gov website belongs to an official
government organization in the United States.
Secure .gov websites use HTTPS
A lock (
) or https:// means you've safely
connected to the .gov website. Share sensitive
information only on official, secure websites.
Secondary plot, K′m versus three novel inhibitors in the range of 0–130 μM and in different concentration of substrate 20–124 μM. All experiments performed in 37°C and phosphate buffer, pH=7.5.