Figure 5.

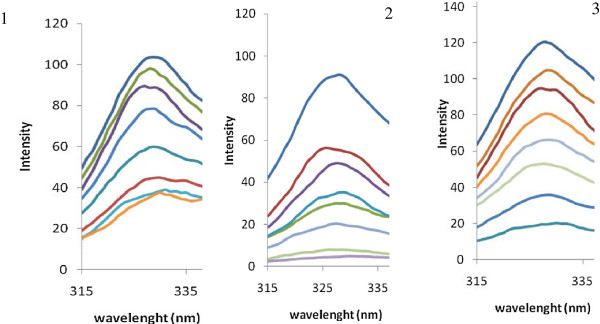
The fluorescence spectra of adenosine deaminase at pH=7.5 and T=37°C in the presence of different concentrations of three inhibitors: 10–100 μM.

The fluorescence spectra of adenosine deaminase at pH=7.5 and T=37°C in the presence of different concentrations of three inhibitors: 10–100 μM.