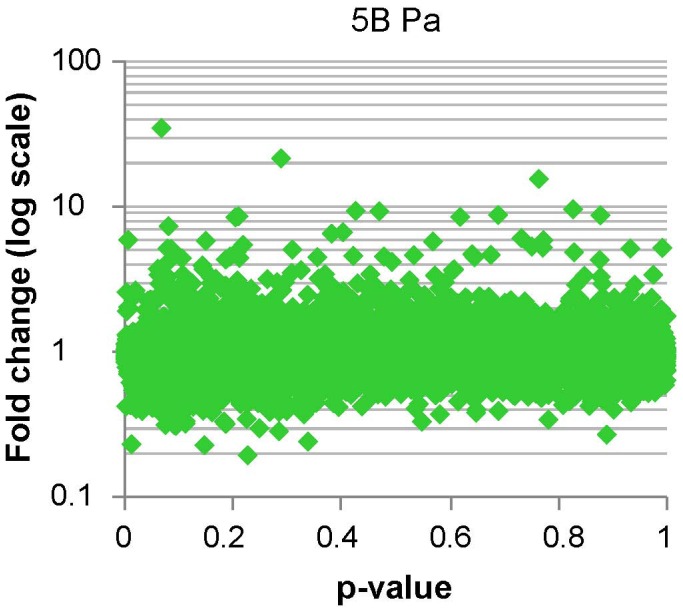
Figure 7. Microarray analysis of the Pa bio-panning, significance vs. fold-change plot.
cDNA from the T7LAtPa library (L) and the clones selected after bio-panning (B) was hybridized to AROS microarrays. For each gene spotted in the microarray the B/L ratio and the statistical significance of B/L≠1 were determined. The plot represents the B/L ratio as a fold-change in the Y-axis (log values centred around 1) and the p-values for the statistical test in the X-axis. Genes with highest fold-change (maximum enrichment after bio-panning selection) and lowest p-value represent the best candidates as Pseudomonas-bound clones.

