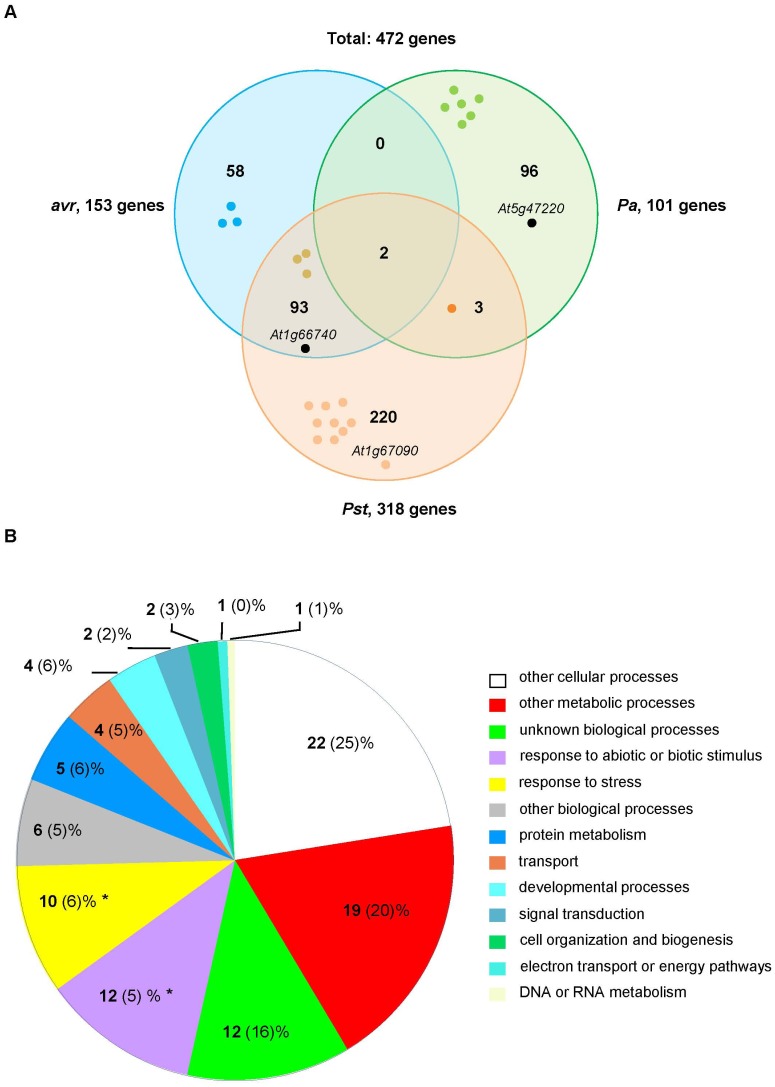
Figure 9. Overlapping and categorisation of the gene sets defined by significance analysis of microarray data.
(A) The analysis identified 3 sets of genes: 101, 153 and 318 genes were selected after bio-panning against Pa, Pst(avrRpt2) (avr) and Pst strains respectively. The sets are represented as overlapping Venn diagrams and the number of shared genes is shown in the intersections. The union of the 3 sets produces a total of 472 genes as candidate MAMP/effector ligands. The positions of At1g66740 (AtSP7), At1g67090 (RBCS1A) and At5g47220 (ATERF-2) are shown in each set. Gene products that produced immune interactions in PPIN-1 are represented by coloured dots. (B) Genes in the 472-gene set were annotated according to the GO categories for Biological Process and the percentage of annotations falling in each category (in bold) was compared to the percentage produced by the 26,303 genes spotted on the microarray (in brackets). Categories with significant (p<0.01) over-representation are shown by asterisks.

