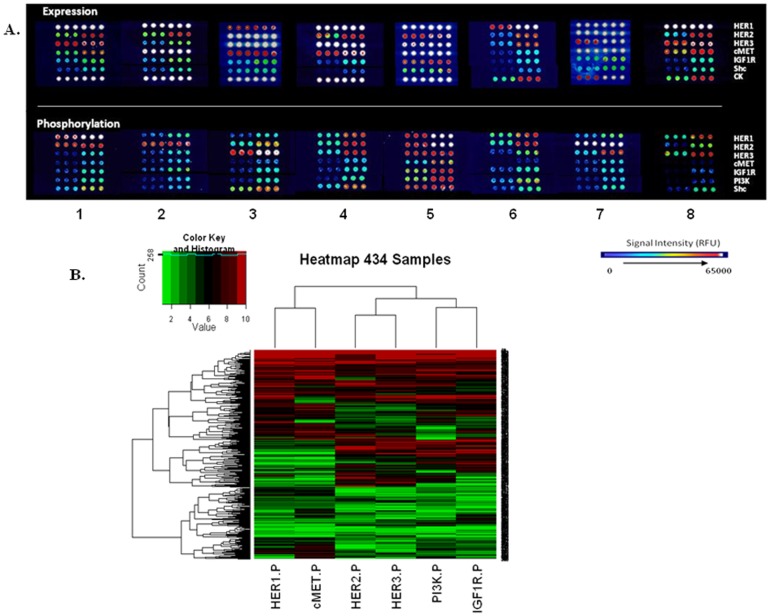
Figure 2. Profiling of phosphorylated markers in gastric cancers.
(A) Representative immuno-array images for pathway profiling of indicated signal transduction proteins. Array signal intensity ranges from black/dark blue (low) to red/white (high/saturation). (B) Heat map and hierarchical clustering of the 434 samples based on CU values from CEER assay for phosphorylated markers measured at 10 µ g lysate concentration. Each column represents a marker and each row represents a patient sample. Relative levels of phosphorylation are depicted with a color scale where red represents the highest level of activation and green represents the lowest level. The CU values for each marker (column) were ranked by deciles. Jitter, between 0 and 0.1, was added to each biomarker CU value to create equally sized bins. Row and column dendrogram show the result of the hierarchical clustering calculation.

