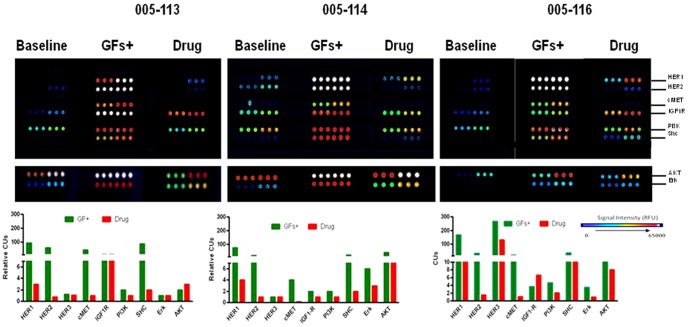
Figure 4. Profiling of phosphorylated markers in CTCs and ATCs from gastric cancer patients.
RTK and downstream pathway profiling in ATCs isolated from 3 patients after ligand (EGF, Heregulin, HGF and IGF) stimulation with or without 2 µM inhibitor cocktail (lapatinib and PHA-665,752) or DMSO. Relative CU is defined as the ratio of CUs over baseline (no ligand or drug treatment).

