Figure 5.
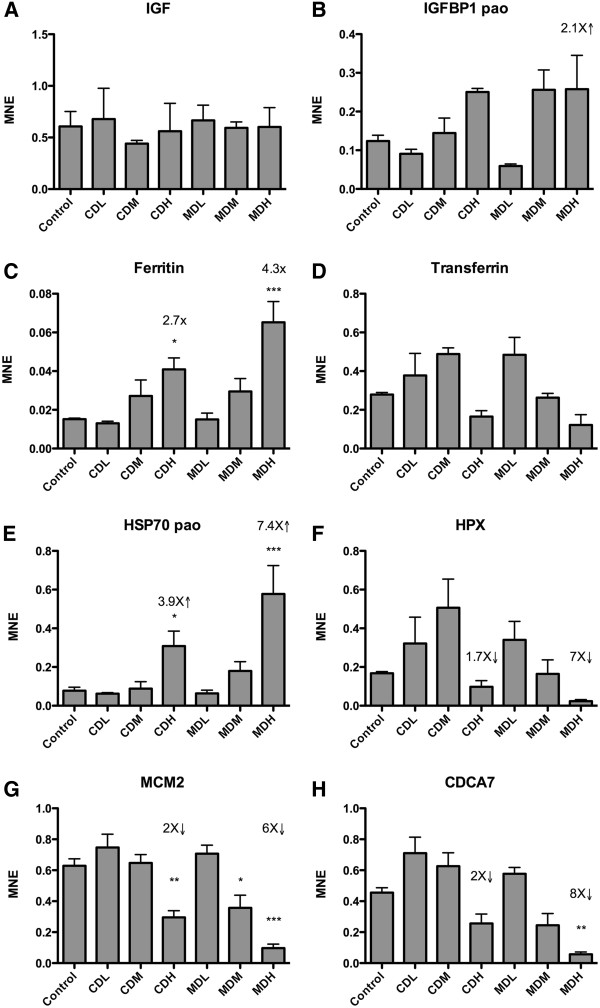
Transcriptional levels of a selected number of genes analyzed with RT-qPCR.A) IGF, B) IGFBP1, C) ferritin, D) transferrin, E) HSP70, F) HPX (WAP65-2), G) MCM2, and H) CDCA7. All groups n = 4 except MDM and MDH n = 3. MNE = mean normalized expression. The raw Ct values were transformed to quantities and PCR efficiency corrected according to the geNorm manual, and divided by the normalization factor calculated from four reference genes by geNorm. Arrows and numerals show fold changes. * P<0.05, **P<0.01. ***P<0.001.

