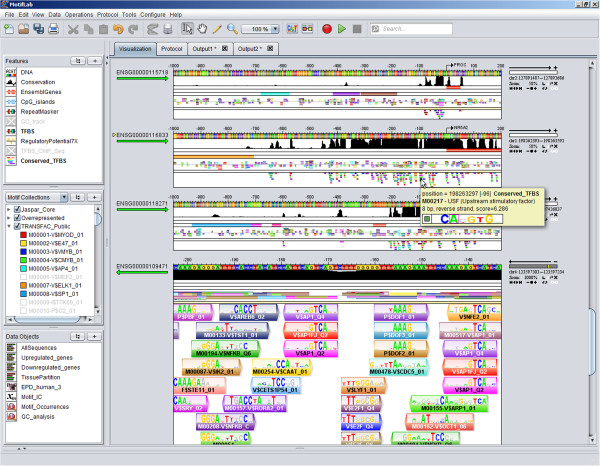
Figure 1.
MotifLab’s graphical user interface. The screenshot shows MotifLab’s graphical user interface with three data panels to the left and with the sequence browser to the right taking up most of the screen space. The top data panel contains the feature datasets in the order they are visualized as tracks in the sequence browser, the middle data panel contains the motifs and modules, and the bottom panel contains miscellaneous data objects that to not belong in the first two panels. Features and motifs that are greyed out in the data panels are hidden from view in the sequence browser. The bottommost sequence shows a motif track in “close-up mode” which is activated at zoom-levels above 1000%. The binding sites are shown with superimposed “match logos” where the base matching the DNA sequence in that position is shown in colour and the other three bases are greyed out.

