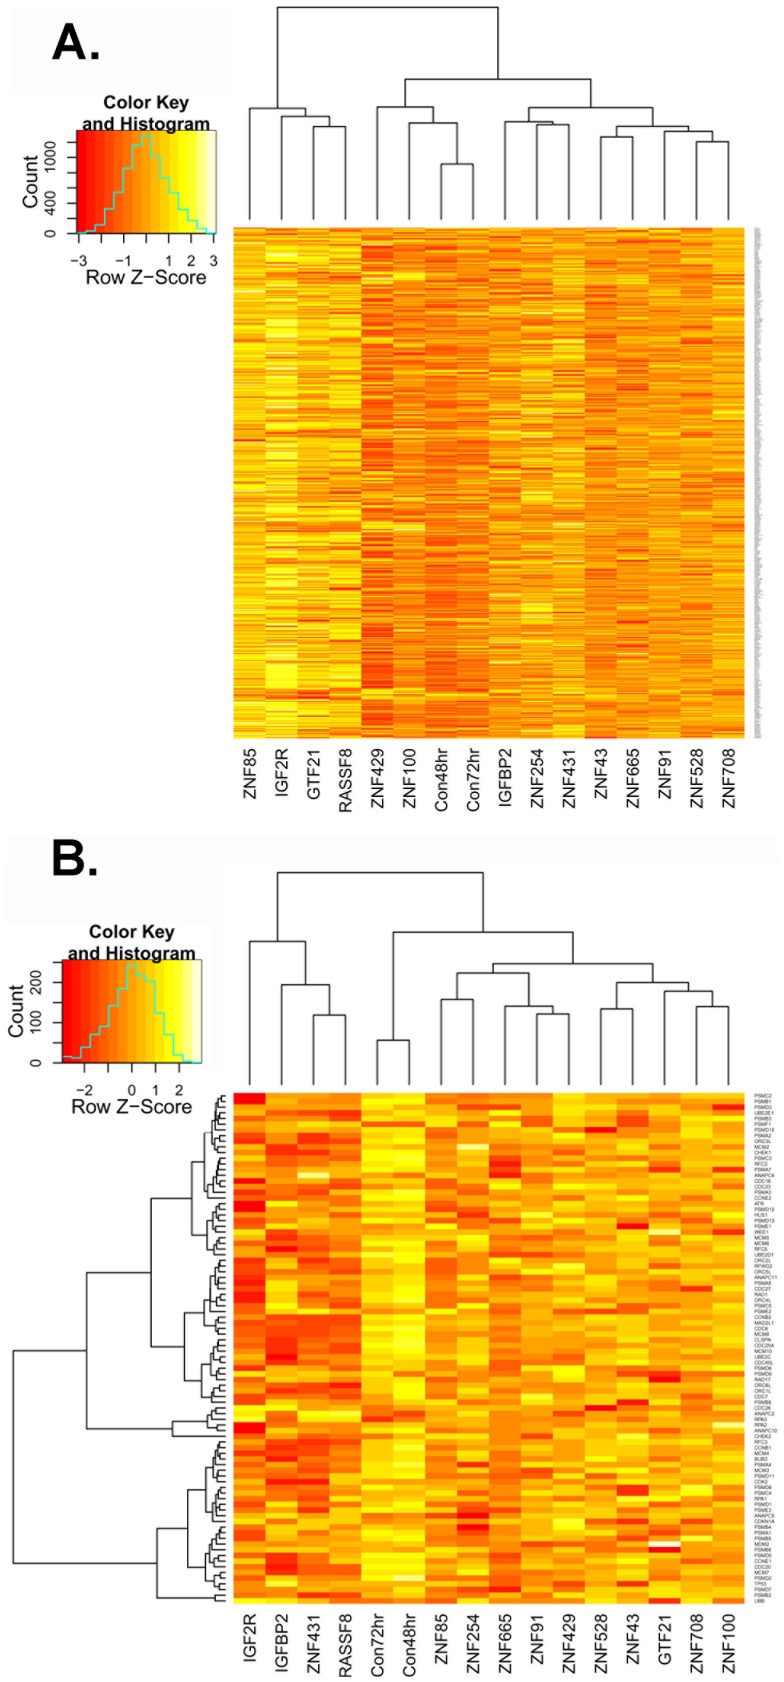
Figure 5. Heatmaps of relative expression levels for genes in two gene sets using row (gene) averaging to provide relative differences.
(A) The heatmap for the genes at 19q13 are shown clustered by sample. The four samples on the left (knockdowns of ZNF85, IGF2R, GTF21, and RASSF8) show the strongest upregulation of gene relative to the siCON samples (Con48 hr, Con72 hr). Knockdowns of ZNF429 and ZNF100 behave much more like controls, as shown by the dendrogram, than do other knockdowns. (B) The heatmap for the Reactome Cell Cycle Checkpoints gene set is provided with clustering on both columns and genes. There is overall downregulation of cell cycle checkpoint genes in knockdowns relative to siCON samples, with knockdowns of IGF2R, IGFBP2, ZNF431, and RASSF8 showing the largest overall changes. In this case, no knockdown samples cluster closely with the controls.

