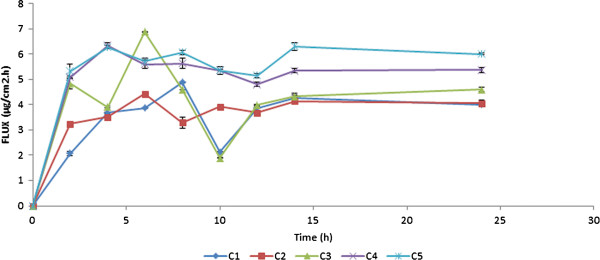
Figure 4.

Graph showing the plot between Flux (μg/cm2.h) and time (h) for C1, C2, C3, C4and C5patches (data represented as mean ± S.D).

Graph showing the plot between Flux (μg/cm2.h) and time (h) for C1, C2, C3, C4and C5patches (data represented as mean ± S.D).