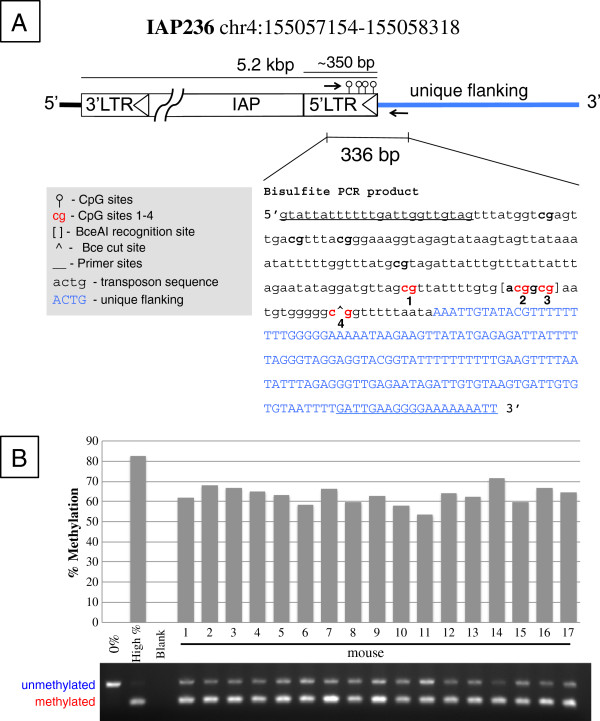
Figure 4.
CoBRA design. For each candidate locus we amplify a portion of the antisense strand of the 5′ LTR and unique flanking sequence (arrows) containing a BceAI recognition site. (A) The product of IAP236 is shown with cut sites and CpGs indicated by numbers 1–4. Sites 2 and 3 are conserved in all candidate loci and cut. PCR primers are underlined. (B) Percent methylation is derived from relative intensity of the cut vs. uncut bands. This locus exhibits an 18% range in variable methylation. Controls are shown in lanes 1 and 2, indicating the specificity and completeness of the digestion.

