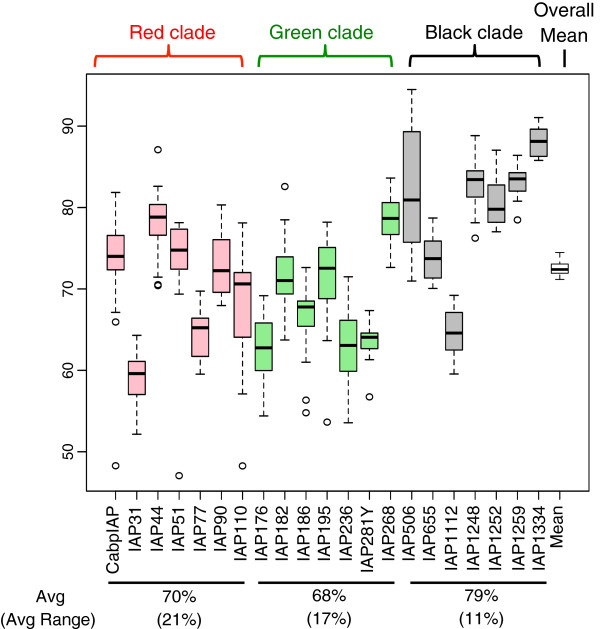
Figure 6.
Boxplot of methylation values. Interindividual variation in each IAP correlates with phylogenetic clade. Average methylation values are lower for red and green clades (70% and 68%) than for the black clade (79%) suggesting higher methylation for older insertions. The average range per clade, in parentheses, is also lower, however the standard deviation is similar across clades.

