Figure 3.
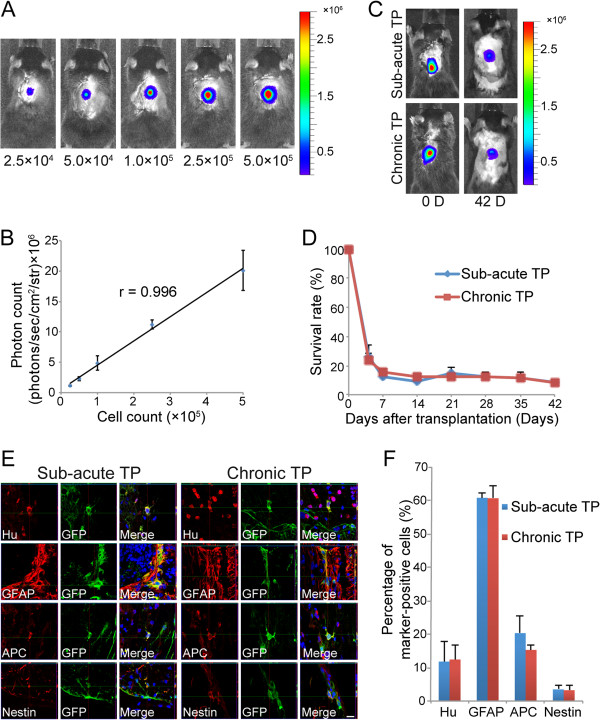
Survival rate and differentiation phenotype of grafted cells in the sub-acute and chronic TP groups. A, Representative in vivo BLI of naïve mice transplanted with various numbers of NS/PCs. B, The number of NS/PCs and the measured photon count were significantly correlated in vivo. Values are means ± SEM (n = 3). C, Representative in vivo BLI of the sub-acute and chronic TP groups immediately and 42 days after transplantation. D, Quantitative analysis using BLI revealed no significant difference in the survival rate of grafted cells between the sub-acute and chronic TP groups up to 42 days after transplantation. Values are means ± SEM (n = 10). E, GFP+ grafted cells differentiated into Hu+ neurons, GFAP+ astrocytes, and APC+ oligodendrocytes in the sub-acute and chronic TP groups. F, The differentiation rate of grafted cells into the three neural cell lineages did not significantly differ between the sub-acute and chronic TP groups 42 days after transplantation. Only a small number of nestin+ neural progenitor cells was detected in the sub-acute and chronic TP groups. Values are means ± SEM (n = 3). Scale bar: 10 μm in (C).

