Figure 3.

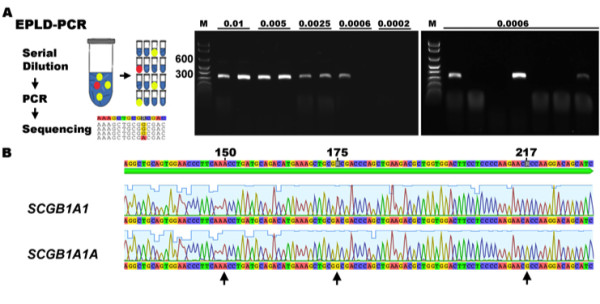
End-point limiting dilution PCR strategy. (A) Left: Schematic illustration of EPLD-PCR. Center: Serial cDNA dilutions (ng/μl) were tested to determine an approximate limiting dilution concentration of template. Right: Each selected limiting dilution was further tested to confirm the PCR efficiency. Here, 3 out of 7 PCR amplifications were positive for the specific 256-bp amplicon, confirming a <50% expected value (efficiency = 33%). (B) EPLD-PCR amplicon sequences. Only SCGB1A1 and SCGB1A1A were identified on the chromatograms using the gene-specific signature (arrows). No SCGB1A1P cDNA was identified. M, 100-bp marker; concentrations are indicated in ng/μL.
