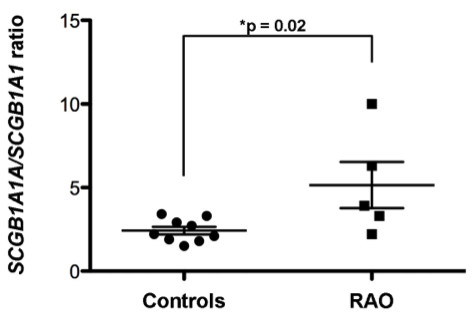
Figure 6.

SCGB1A1 and SCGB1A1A expression analysis in lung tissues from control and RAO horses. Quantification of SCGB1A1 and SCGB1A1A RT-PCR products was relative to both equine GAPDH and ribosomal 18S gene expression levels. Values are displayed as SCGB1A1A/SCGB1A1 ratios. In control horses, the gene expression ratios were consistently and significantly lower compared to those of age-matched RAO horses (2.4 ± 0.2, n = 9 vs 5.1 ± 1.4, n = 5, respectively). Lung biopsies from RAO animals were from either exacerbation or remission periods.
