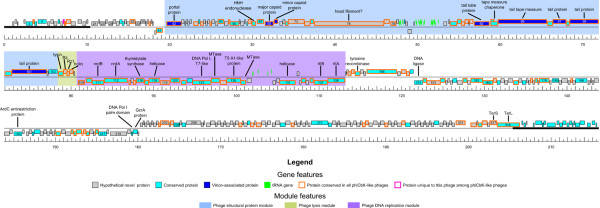
Figure 2.

Genomic map of C. crescentus phage phiCbK. Predicted genes are represented by boxes above and below the black line; boxes above the line are genes encoded on the forward strand, those below the line are on the reverse strand. Segments of heavier black line at each end of the genome represent the 10.3 kb terminal repeats present in the genome. Gene features (conserved, unique, hypothetical novel and virion-associated proteins; tRNA genes) and genome modules (assembly, lysis and DNA replication) are color-coded according to the legend below the figure. Selected genes and gene modules are annotated based on predicted function, as documented in Table S1 and the text. The ruler below the genomes indicates scale in kb.
