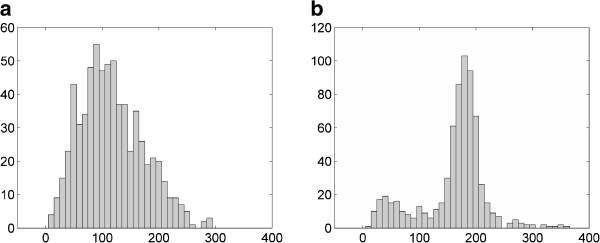
Figure 3.

Comparison of histograms of signal intensity between (a) T2W and (b) PDW MRI. Histograms were obtained based on a small ROI placed around the tip of the tandem. Two peaks corresponding to the uterus and the tandem were overlapped in the T2W image but separable in the PDW image.
