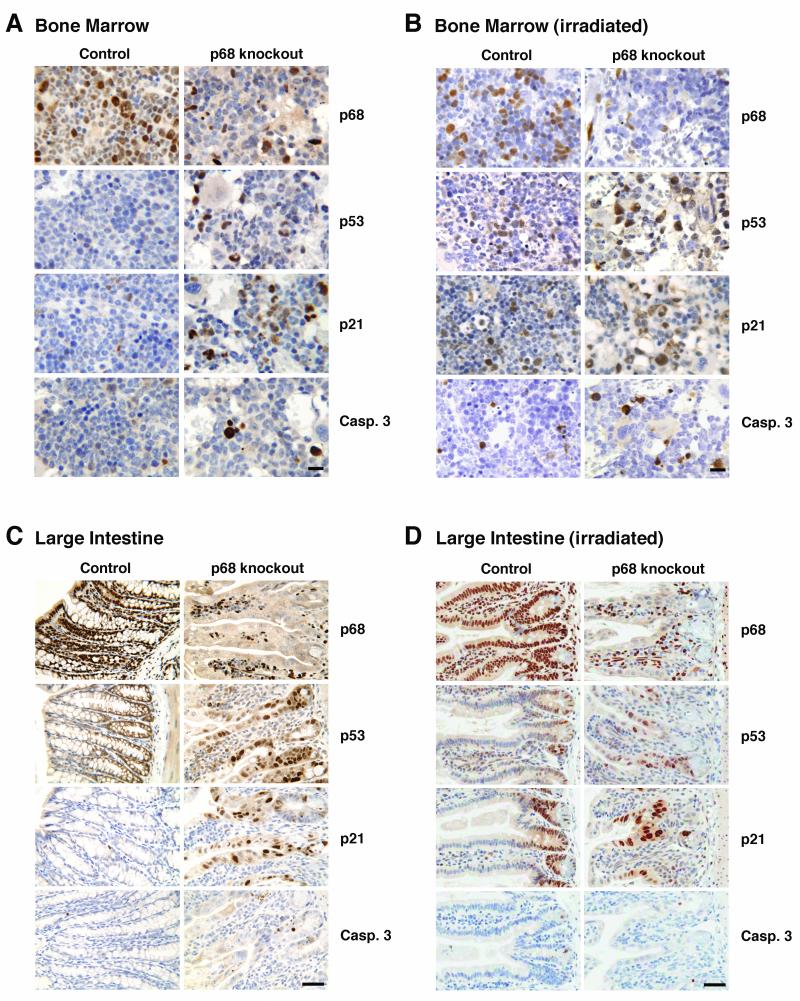
Figure 5. The p53 DNA damage response in bone marrow and large intestine from p68 knockout mice.
Immunohistochemistry showing p68, p53, p21 and caspase-3 expression in: bone marrow (A, B) and large intestine (C, D) from untreated and γ-irradiated control and p68 knockout mice. Tissues were harvested 2 h after irradiation. Images are representative of 6 control and 6 p68KO mice. Bar= 50μm.

