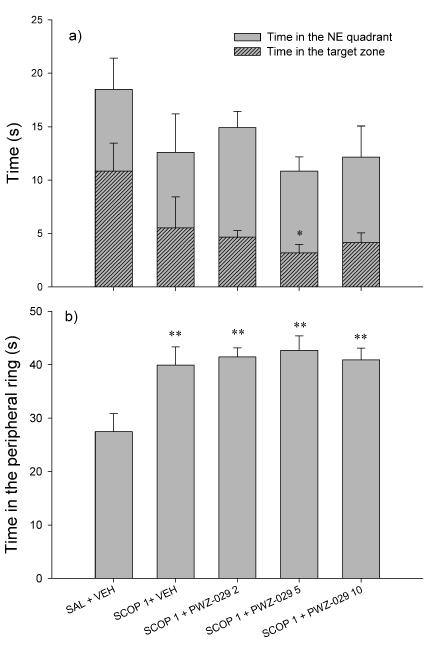
Figure 6.
The representative parameters of water-maze performance in the probe trial: (a) time spent in the NE quadrant and time spent in the target zone (stripped bars), and (b) time in the peripheral ring. Data are represented as mean + S.E.M. *p < 0.05, **p < 0.01, compared to control (SAL+VEH). Number of animals per treatment group was 8. SAL= saline, VEH= vehicle.

