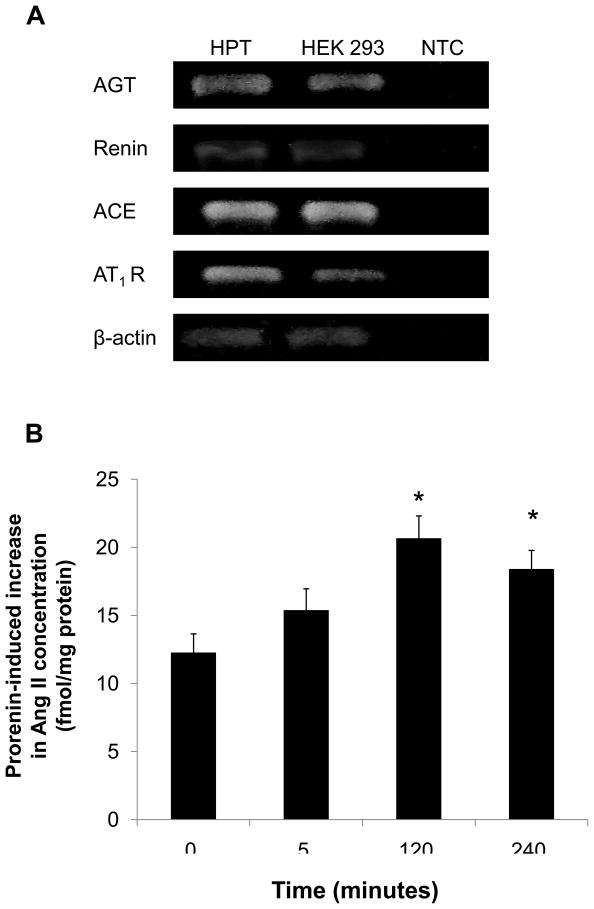
Figure 6.
RT-PCR expression analysis of all the RAS components. HPT and HEK293 cells were analyzed by RT-PCR. AGT: angiotensinogen; ACE: angiotensin-converting enzyme. β-actin served as positive control. A reaction without a non-template control served as negative control (NTC). Intracellular Ang II concentration in HEK293 cells (B). Bar graphs represent mean ± SE (n=6), expressed as fold change compared with vehicle-treated cells. *P<0.05 vs. vehicle-treated cells.

