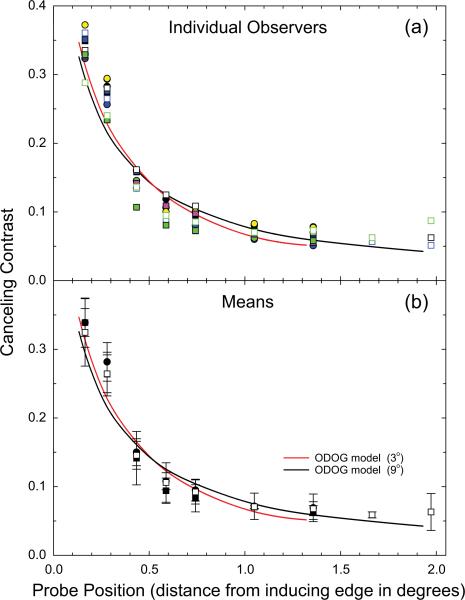
Fig. 4.
Canceling contrast plotted as a function of distance from the inducing field edge measured using the quadrature-phase motion cancelation technique. The symbols in panel (a) plot the results from the four individual observers (indicated by color) for the 4 Hz, 3° test field height (filled circles); 1 Hz, 3° test field height (filled squares) and 1 Hz, 9° test field height (open squares) conditions. The symbols in panel (b) plot the means and 95% confidence intervals for these four observers for the same conditions: 4 Hz, test field 3° (filled circles); 1 Hz, test field 3° (filled squares); 1 Hz, test field 9° (open squares). The individual and mean data clearly indicate that the magnitude of induction decreases with increasing distance from the test/inducing field edge for both 3° and 9° test field heights. The best fit predictions of the ODOG model (Blakeslee & McCourt, 1999) for the 3° and 9° conditions are indicated by the red and black lines, respectively, in both panels and account for 95% of the overall variance.

