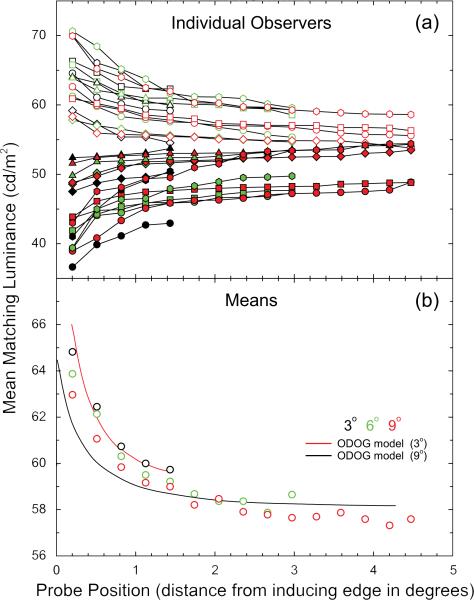
Fig. 5.
Matching luminance as a function of distance from the inducing field edge is plotted separately for five observers (indicated by symbol shape) in panel (a). Matches were obtained for test field heights of 3° (black symbols), 6° (green symbols) and 9° (red symbols) at both the maximum (filled symbols) and minimum (open symbols) inducing grating phase. All subjects show a decrease in the magnitude of induction as a function of the distance from the inducing field edge, despite individual differences in overall induction magnitude. In panel (b) the minimum inducing grating phase data are collapsed across observers and plotted as means along with the linear best fit predictions of the ODOG model for the 3° and 9° conditions. The model predictions are a good fit to the data accounting for 95% of the overall variance in the mean magnitude of induction found with distance from the inducing field edge.

