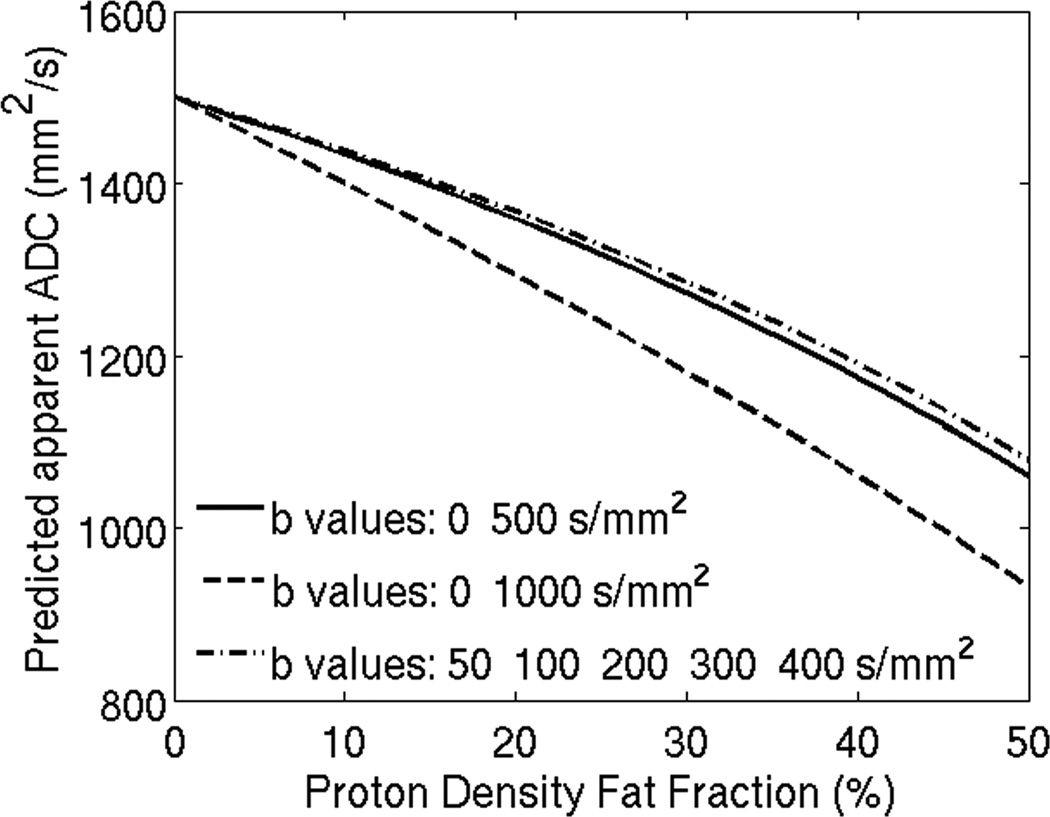
Figure 2.
Choice of b-values impacts predicted apparent ADC when fat is present in tissues, and differences increase with increasing proton density fat-fraction. The b-values used in this simulation correspond to those reported in reference 17 and 18 and also for the b-values used in the clinical study in this work.

