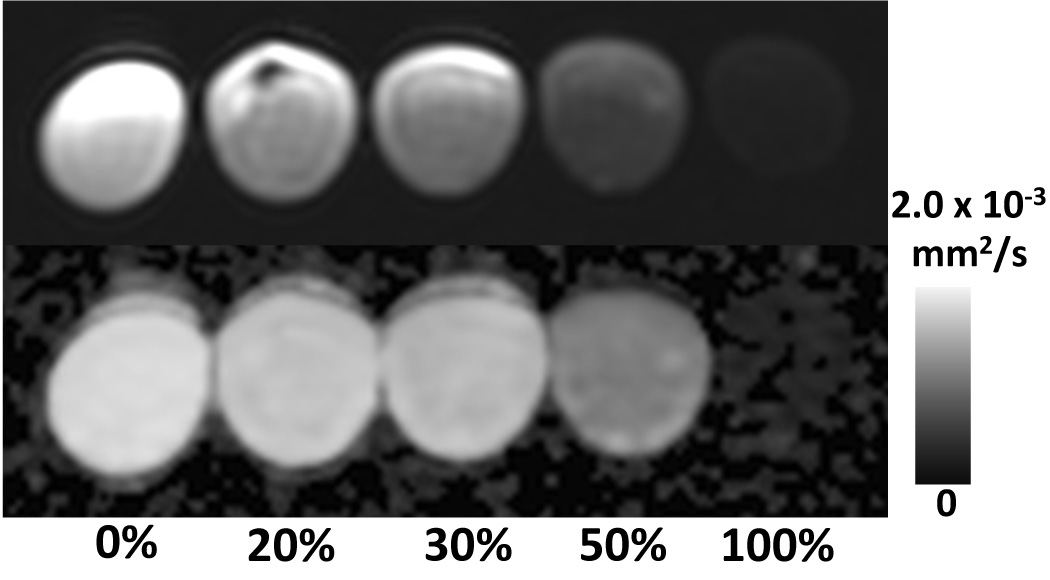
Figure 3.
Water excitation pulses results in excitation of fat signal originating from glycerol and olefinic peaks, using standard DWI sequences. Note the residual signal from the 100% fat –only vial (right). Top: Fat-water phantom vials in ascending order of fat fraction from left to right. Bottom: corresponding ADC-map

