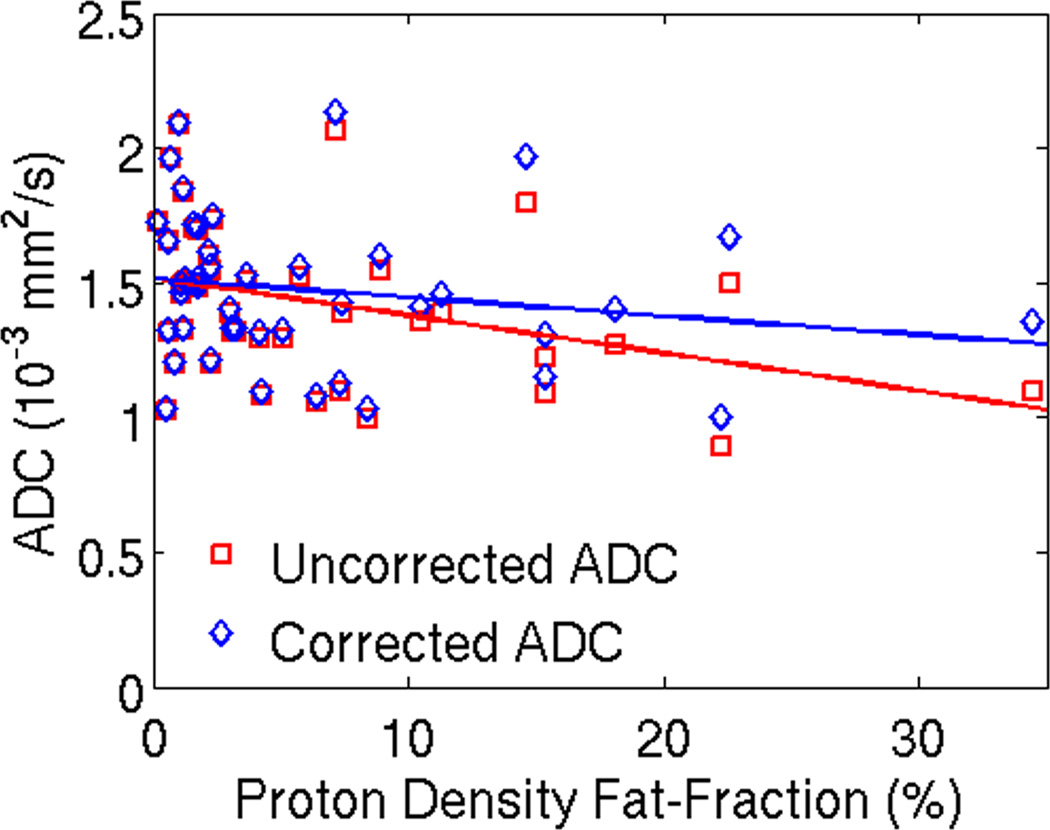
Figure 5.
Uncorrected ADC shows a signifcant decrease in the observed ADC with increasing PDFF, with a statistically significant correlation (r2=0.13; intercept = 1.51 × 10⁻³mm2/s (95% confidence interval = 1.40 –1.62 × 10⁻³mm2/s), slope = –0.014 × 10⁻³mm2/s/PDFF%, (95% confidence interval = −0.025 – −0.003), and p=0.017) After correction for the effects of fat, however, there is no dependence of observed ADC on PDFF (r2 =0.13; intercept = 1.54 × 10⁻³mm2/s (95% confidence interval = 1.40 – 1.62 × 10⁻³mm2/s), slope = −0.007 × 10⁻³mm2/s/PDFF% (95% confidence interval = −0.019 – 0.005), and p=0.24). Linear regression for the two data sets are shown as dashed lines. These results demonstrate that the observed decrease in ADC with increasing PDFF can be explained by the residual effect of the signal from fat resonance peaks near water. ADC measurements were co-localized with MR-Spectroscopy in 43 subjects with a wide range of liver fat. The plot shows ADC plotted against PDFF for all 43 subjects included in this study. Please note that an additional recalculation (not shown) was performed excluding the subject with the highest PDFF - this confirmed repeatable results (ie: the results were not driven by the PDFF outlier).

