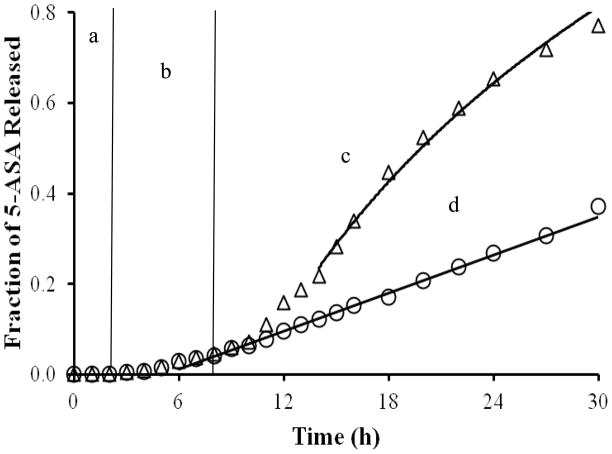
Figure 3.
Release profile of the coated bead product under conditions simulating a. the stomach, b. and c. the small intestine, and d. the colon. The triangles represent coated beads that have been exposed to SGF for 2 h, SIF for 6 h, and then SCF for 22 h. The diamonds represent the coated beads that have been exposed to SGF for 2 h and then to SIF for 28 h. A predictive curve for each profile overlays the corresponding data.

