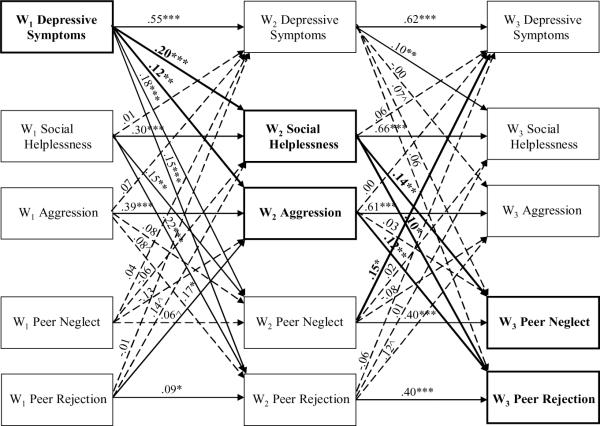
Figure 2.
Study 2: Standardized path coefficients for final model in early adolescence. *p < .05. **p < .01. ***p < .001. Nonsignificant paths indicated by dotted lines; significant paths of interest designated in bold. W1 within-wave correlations: rs = .20 – .88, ps < .001; W2 and W3 within-wave correlated errors: rs = .09 – .82, ps < .05. W1 social helplessness to W2 aggression: B = .04, ns; W1 aggression to W2 social helplessness, B = .11, p < .05. W1 neglect to W3 rejection: B = .01, ns; W1 rejection to W3 neglect, B = .02, ns.

