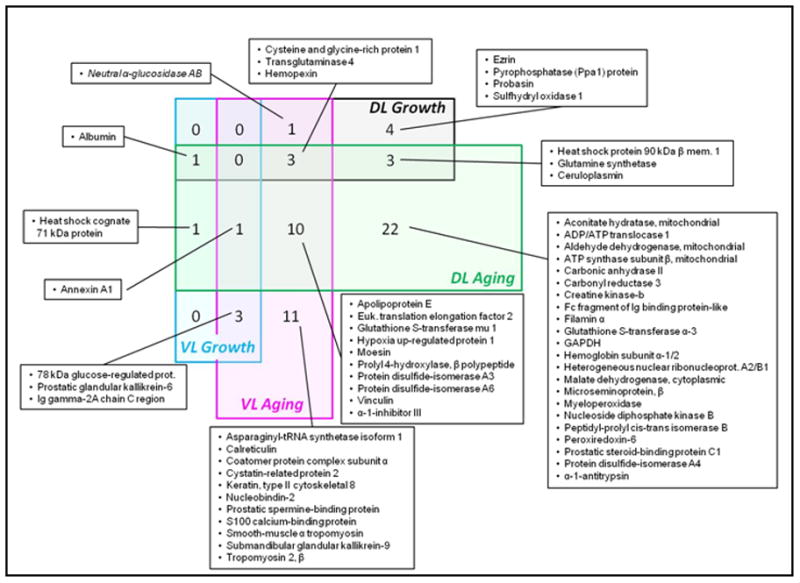
Figure 2.

Venn diagram of proteins commonly affected during growth and development or during aging in the prostate DL and VL. Four larger rectangles represent the number of proteins being altered significantly in four major categories, DL growth and development (part of Table 3), DL aging (part of Table 4), VL growth and development (part of Table 3) and VL aging (part of Table 4). Addition of number of proteins from eight small boxes within each major category would match the total number of proteins being changed significantly in the respective category. Each small box represents the overlapping number of proteins between two, three or four major categories.
