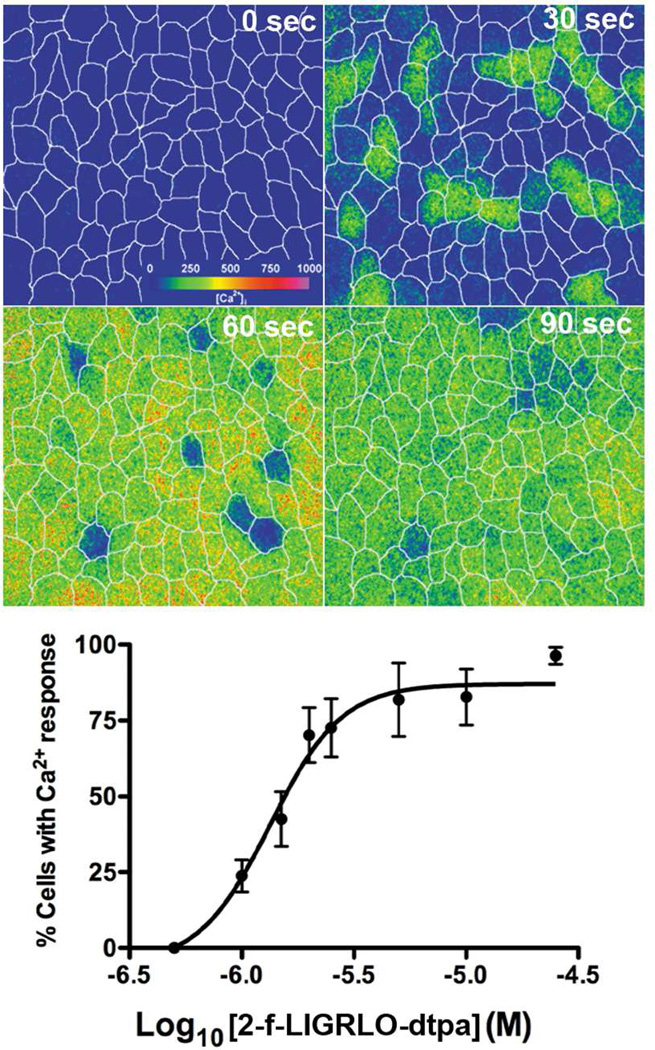
Figure 4. 2-f-LIGRLO-dtpa stimulates Ca2+ signaling in model epithelial cells.
16HBE14o-cells were exposed to 2-f-LIGRLO-dtpa and [Ca2+]i was monitored over time. (A) Individual panels depict [Ca2+]i in all cells within a field of view at listed times (sec) following application of 5 µM 2-f-LIGRLO-dtpa at time 0. White lines approximate individual cell borders in each image and estimated [Ca2+]i is depicted in the color bar shown in upper left panel. 2-f-LIGRLO-dtpa stimulates a rapid increase in [Ca2+]i that reaches peak changes by 45 – 60 sec in most cells and begins to return towards base line by 90 sec. (B) Percentage of cells in the field of view that show [Ca2+]i responses within the 3 min experiment are graphed as a concentration response to 2-f-LIGRLO-dtpa. The calculated EC50 of 2-f-LIGRLO-dtpa for a Ca2+ response is 1.34 µM, comparable to known full PAR2 agonists9. A minimum of 3 and maximum of 9 experiments are plotted for each concentration shown in (B).

