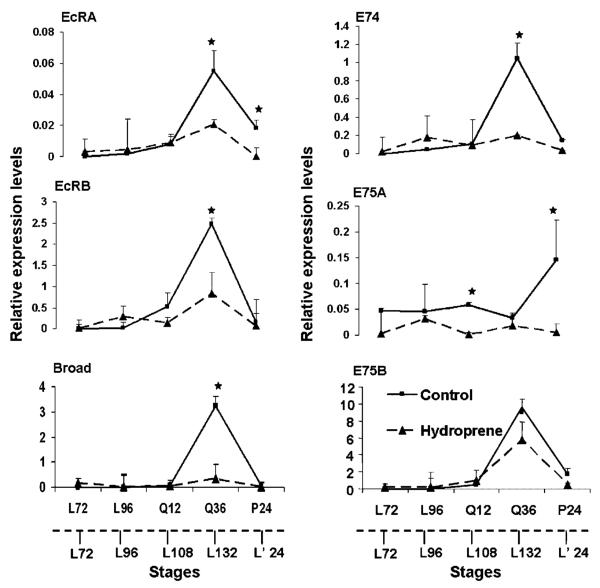
Figure 6.
Relative expression levels of 20E-induced genes in the midguts of hydroprene-treated and control insects. The mRNA levels were normalized using the ribosomal protein levels and quantified using qRT-PCR analysis. The solid lines represent the control insects and the dotted line represents the hydroprene-treated insects. The solid X-axes represent the stages of control insects (L72, L96; hours after ecdysis into final instar larvae; Q12, Q36: hours after entering the quiescent stage; P24: hours after ecdysis into pupal stage). The dotted X-axes represent the stages of hydroprene-treated insects (L72-L132: hours after ecdysis into final instar larvae, L’24: hours after supernumerary larval molt). The significance of means at each time-point between control and hydroprene-treated was tested by the Two-tailed paired “t”-test using Statistix 8.0 software. Stars: Significance at P<0.05. Mean±S.D. of three replications for each time point are shown.

