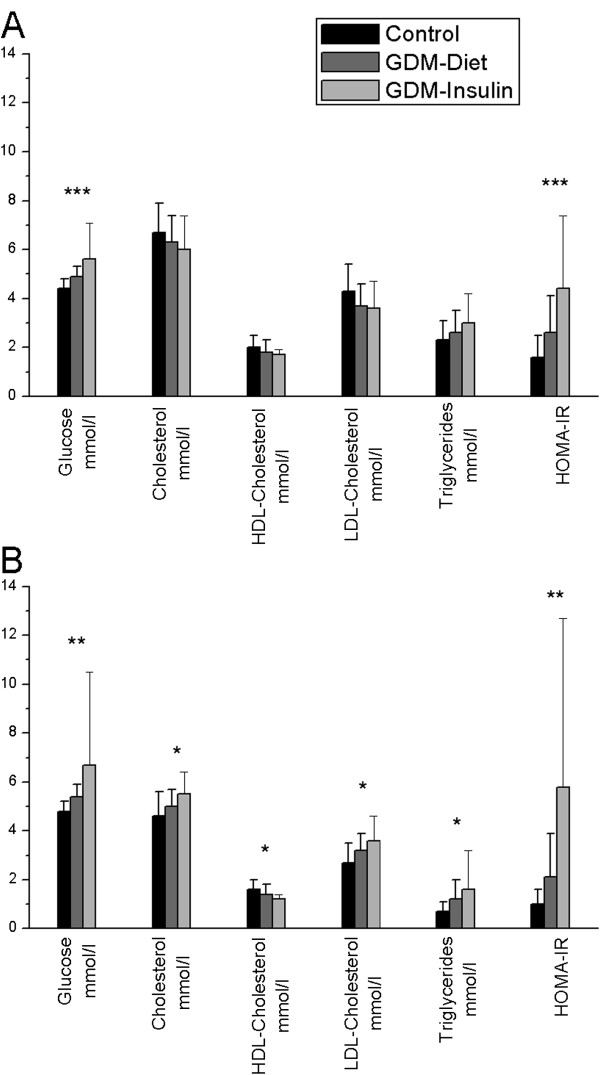
Figure 1.
The differences in metabolic variables between the groups (mean ± standard deviation). A= during pregnancy, B= 3 months after delivery. *= P <0.05, ** =P <0.01, ***=P < 0.001. Comparisons performed using One-Way ANOVA. The numbers of subjects in each group correspond to those in Table 2.

