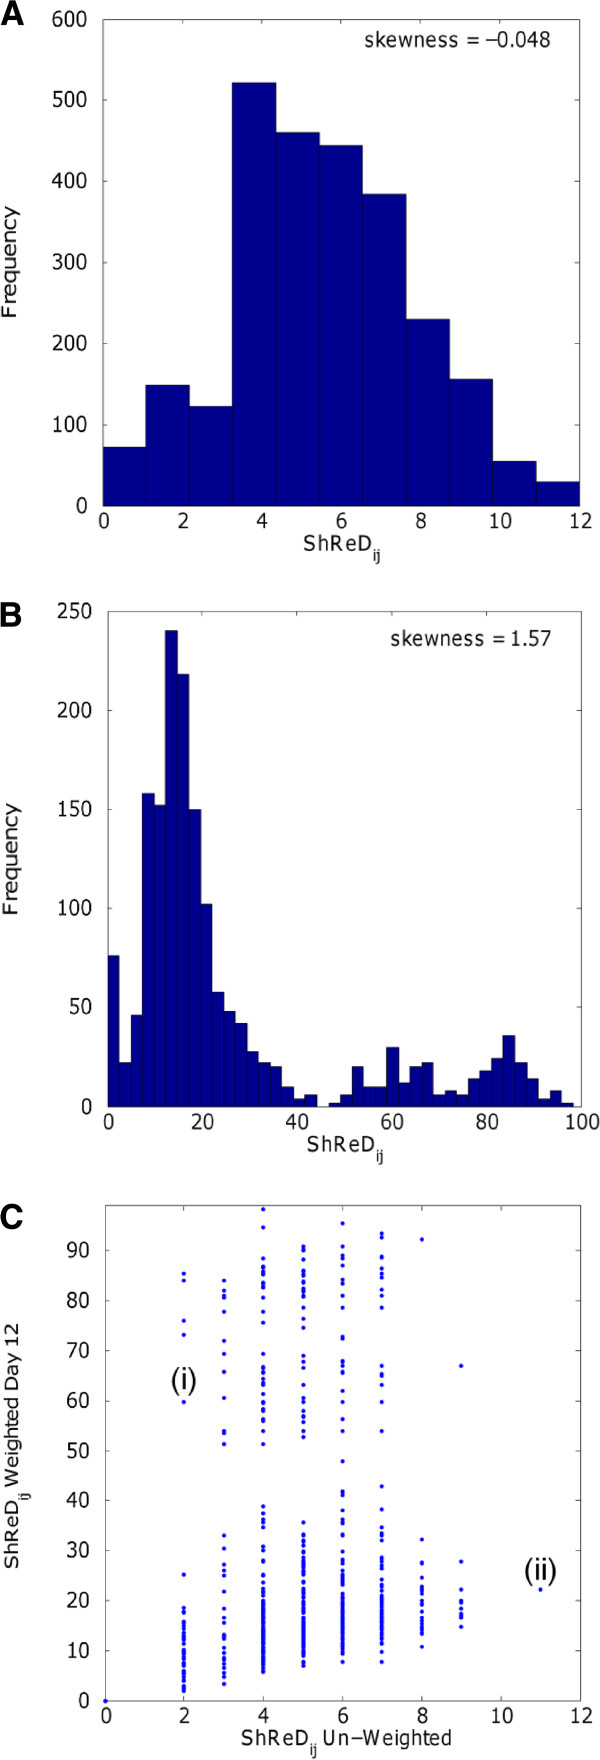
Figure 1.
(A) Distribution of ShReD values for the un-weighted adipocyte network. The histogram only shows ShReDs with value < 100. (B) Distribution of ShReD values for the Day 12 flux-weighted model. The histogram only shows ShReDs with value <100. (C) Scatter plot of Day 12 weighted ShReD and un-weighted ShReD for all reaction pairs [i, j]. The plot only shows reaction pairs with ShReD value < 100. Points (i) and (ii) represent reaction pairs [R28, R63] and [R42, R50], respectively.

