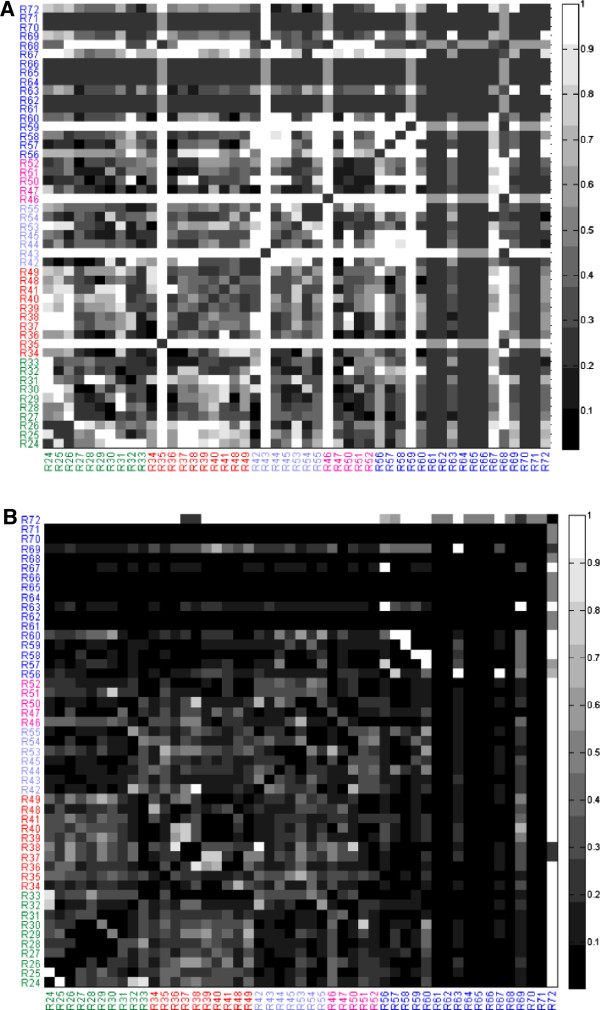
Figure 6.
(A) Heat map of the H-V Euclidean distance between the Day 4 model and Day 12 model (see Methods for definition of distance). (B) Heat map of the H-V Euclidean distance between the Day 12 model and Day 12 model with LDH inhibition. The colors for the reaction numbers correspond to the same group assignments as in Figures 2 and 5.

