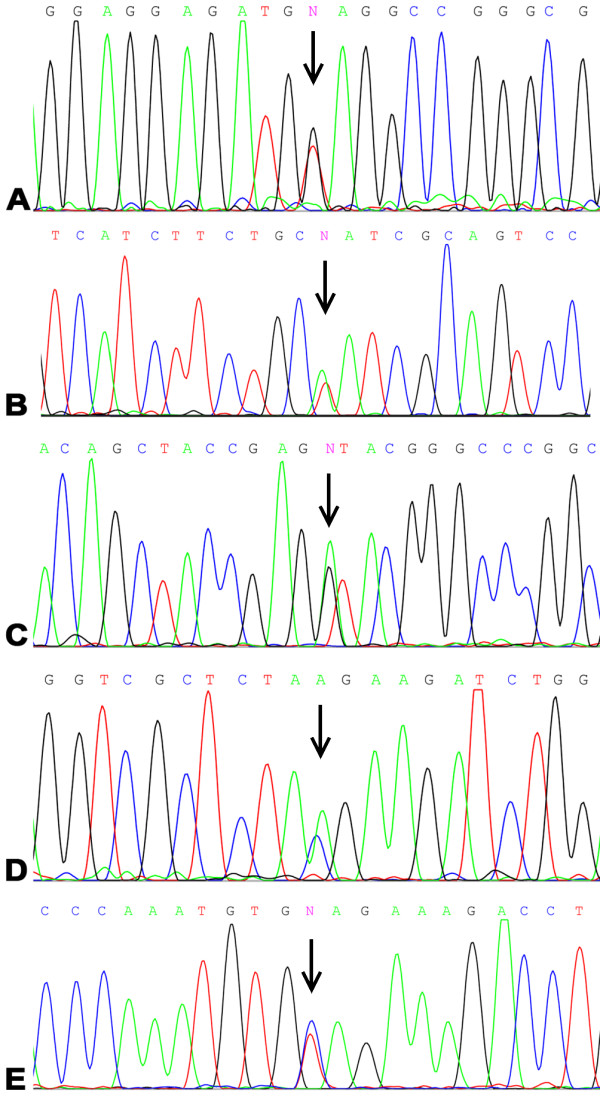
Figure 1.

Electropherograms representing VHL mutations in the study population. Mutations are indicated by arrows. Panel A: c.163 G > T, p.Glu55X; Panel B: c.232A > T, p.Asn78Tyr; Panel C: c.340 + 1 G > A, p.Gly114AspfsX6; Panel D: c.555C > A, p.Tyr185X; Panel E: c.583C > T, p.195GlnX.
