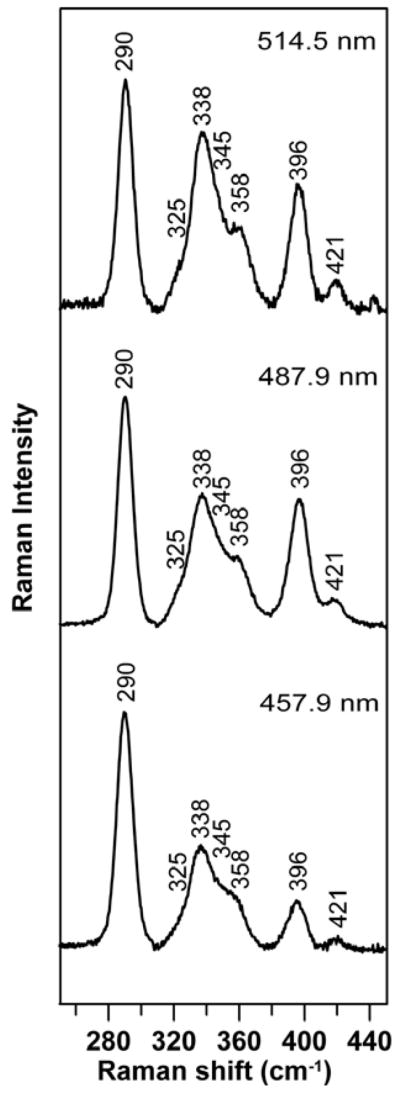
Figure 4.

Resonance Raman spectra of purified -bound form of NifIscA. Raman spectra were recorded at 17 K with 457.9, 487.9 and 514.5 nm laser excitation with ~ 185 mW laser power at the sample. The sample (~2 mM in [2Fe-2S]2+ clusters) was in 100 mM Tris-HCl buffer, pH 7.8 containing ~ 0.45 M NaCl. Each spectrum is a sum of 100 scans, with each scan involving counting photons for 1 s at 0.5 cm−1 increments with 6 cm−1 spectral resolution. Bands due to lattice modes of ice from frozen buffer in sample have been subtracted from all spectra.
