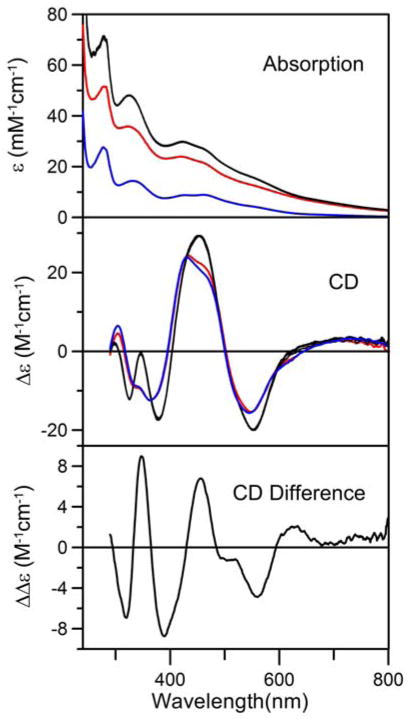
Figure 9.
Time course of cluster transfer from [4Fe-4S]2+ cluster-bound NifU to apo- NifIscA monitored by UV–visible absorption and CD spectroscopy under anaerobic conditions at room temperature in the absence of DTT. Upper and middle panels show UV–visible absorption and CD spectra of the reaction mixture containing [4Fe-4S]2+ cluster-bound NifU (35 μM in NifU monomer with one [4Fe-4S]2+ clusters and one permanent [2Fe-2S]2+ cluster per monomer) and apo-NifIscA (100 μM in NifIscA dimer) recorded before addition of apo-NifIscA (zero time, red lines) and 5, 10, 20, 30, and 50 min after addition of apo-NifIscA (overlapping black lines). The UV–visible absorption and CD spectra of NifU containing only the permanent [2Fe-2S]2+ cluster are shown for comparison (blue lines). The lower panel shows the 50 min minus zero time difference CD spectrum that is characteristic of [2Fe-2S]2+ cluster-bound NifIscA. All ε, Δε, and Δεε values are expressed per NifU monomer.

