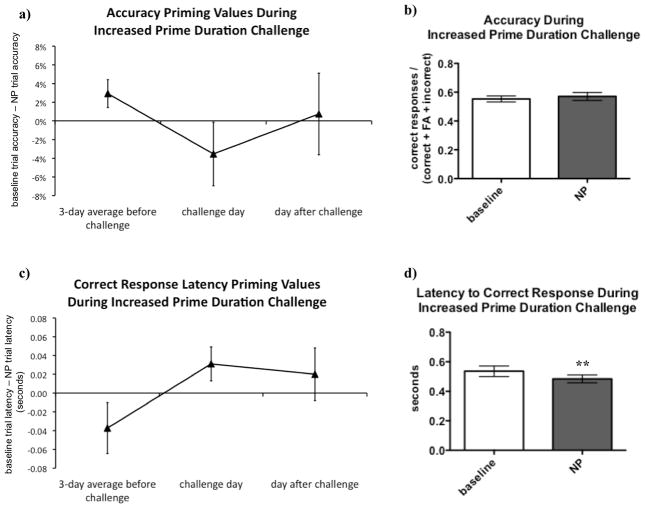
Figure 3.
Decreasing the duration of the prime stimulus disrupted negative priming (NP). On the day of the increased prime duration challenge, accuracy priming values became less positive (A), reflecting less NP, although this effect did not reach statistical significance [F(2, 24) = 1.06, p > 0.1]; no significant difference between accuracy in baseline and NP trials [t(12) = 0.94, p > 0.1] was detected on the day of the challenge (B). Likewise, there was a trend for correct latency priming values to become less negative on the day of the challenge [F(2, 24) = 2.78, p = 0.08], also reflecting less NP (C); correct response latencies during NP trials were actually shorter than during baseline trials (the opposite pattern from that predicted by NP) during the challenge [t(12) = 3.34, p < 0.01] (D).
Data were analyzed using repeated-measures analyses of variance (ANOVA) to compare the priming values during challenge to the sessions before and after the challenge. When statistically significant effects were found in the ANOVAs, post hoc comparisons among means were conducted using Newman-Keuls tests. Paired two-tailed t-tests were used to compare performance during baseline and NP trials on the duration challenge days. The level of significance was set at 0.05 throughout. Data were analyzed using GraphPad Prism® (GraphPad, San Diego, CA) and Sigmaplot® (Systat Software Inc., San Jose, CA, USA). Values are expressed as mean ± SEM. Asterisks (**p < 0.01) denote significant differences compared with baseline trials.

