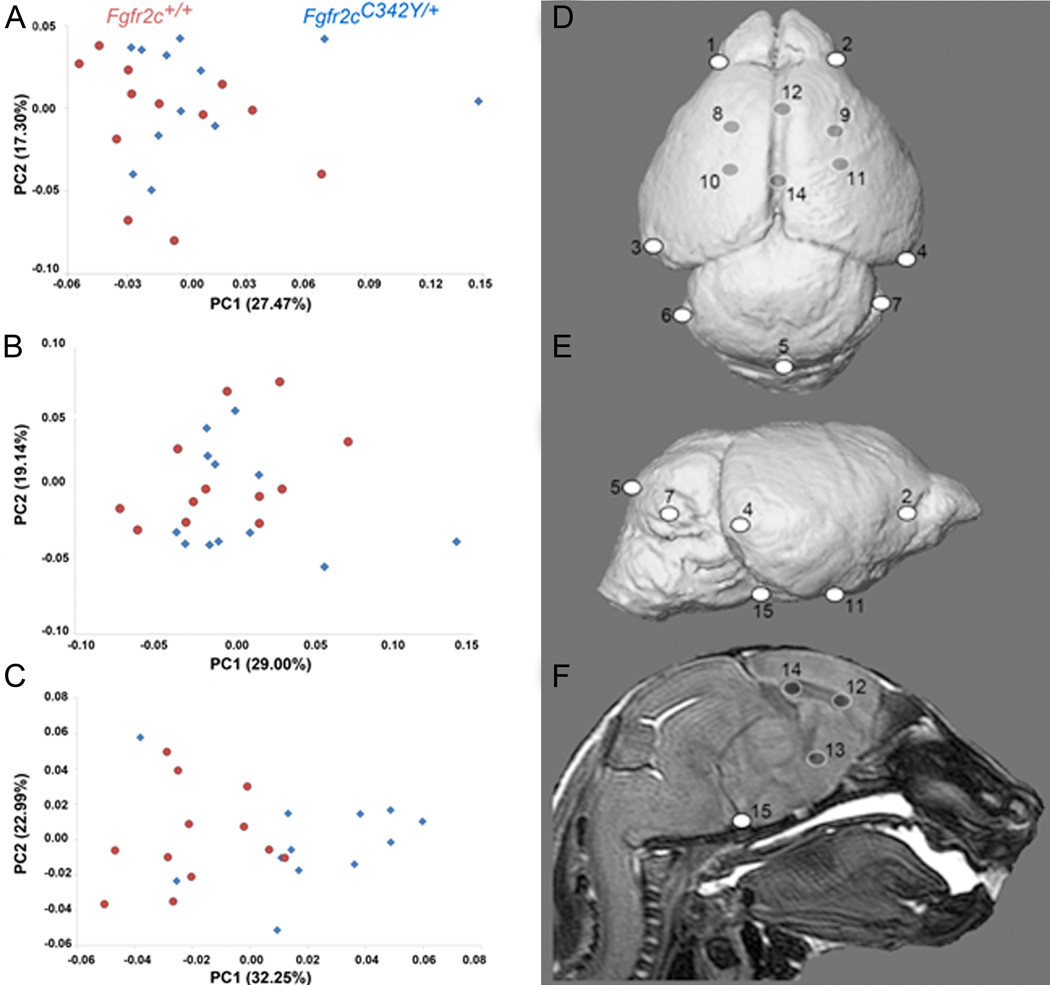
Figure 4.
Results of PCA of brain based on Procrustes coordinates. Scatter plots of individual brain morphologies along PC1 and PC2 of PCA of whole brain (A), surface brain landmarks (B), and subsurface brain landmarks (C). Size related differences in shape (allometry) did not have a significant effect on shape difference of the whole brain or surface landmarks, but there was a significant allometric effect of size (P ≤ 0.05) in the analysis of the subsurface landmarks. Brain landmarks used in analysis visualized on 3D MRM reconstructions of unaffected mouse brain. Views are: D: superior; E: lateral; F : sagittal section. Landmark numbering corresponds with Table 4. For additional views and definitions of these landmarks see: http://www.getahead.psu.edu/LandmarkNewVersion/Mousebrain.html

