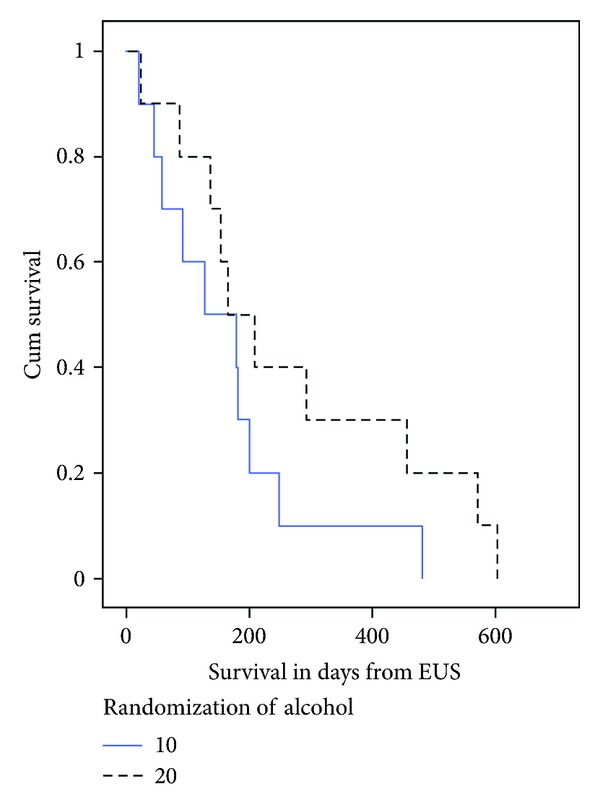
Figure 2.

Survival in subjects by randomization. The survival curve shows the length of survival in days from the EUS-CPN procedure. The slashed line represents subjects in the 20 mL alcohol group, and the straight line represents subjects in the 10 mL alcohol group.
