
Figure 3.
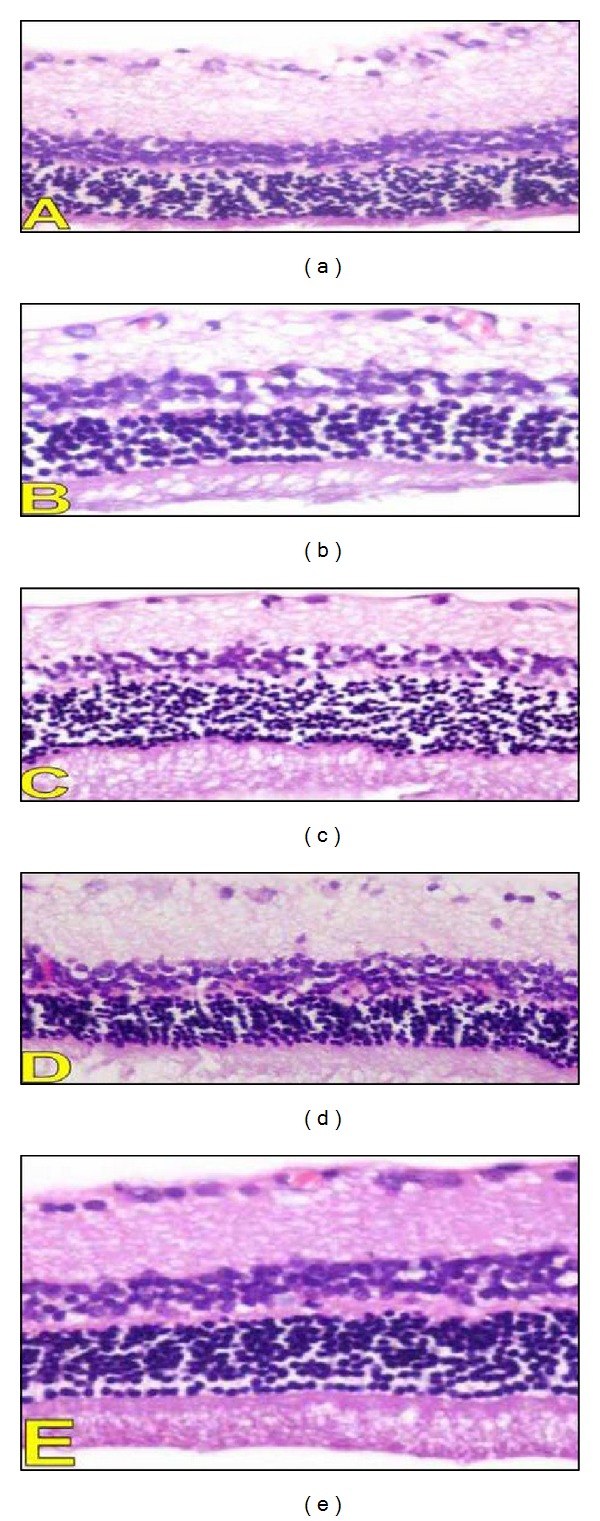
Histopathological findings in the retina. A photomicrography representing H&E sections from different studies groups (A: diabetic group, B–D: diabetic rats treated with 5, 10 and 20% oat in the diet (W/W) respectively, and E: Control group) (200x).