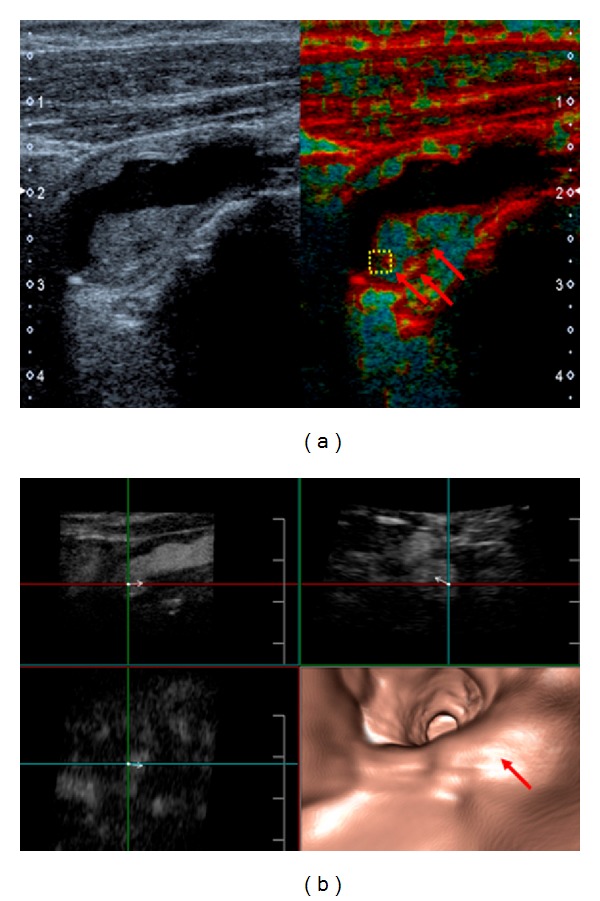
Figure 3.

(a) B-mode and tissue Doppler imaging (TDI) of the patient's ICA stenosis. Brighter red coloring (arrows) indicates increased elastic deformability. (b) Inverse fly-through (FlyThru) technique with an intravessel view from ICA to the common carotid artery (bottom right). The red arrow marks the moderate ICA stenosis. The other three images show contrast-enhanced B-mode US used for the three-dimensional reconstruction of the inverse fly through. By changing the vectors, it is possible to visualize the stenotic segment from all imaginable directions.
