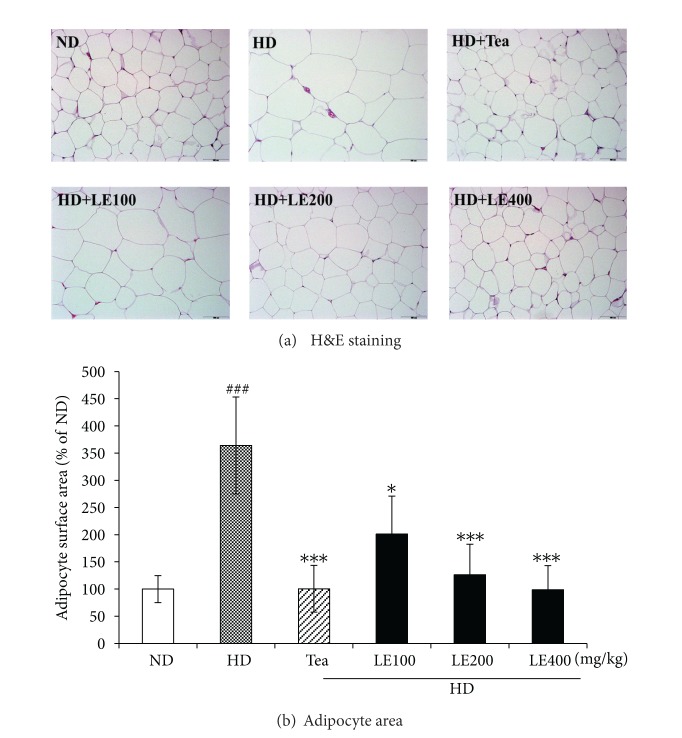
Figure 2.
Histological analysis of epididymal adipose tissue (a) and adipocyte surface area (b) of the rats fed the experimental diets for 6 weeks. All sections were stained with hematoxylin and eosin; magnification, ×200. Magnification bar = 100 μm. Mean surface area for epididymal white adipocytes was measured using Image J software. Data are mean ± SD (n ≥ 8). ### P < .001 versus the ND group; *P < .05, ***P < .001 versus HD group.

