
Figure 4.
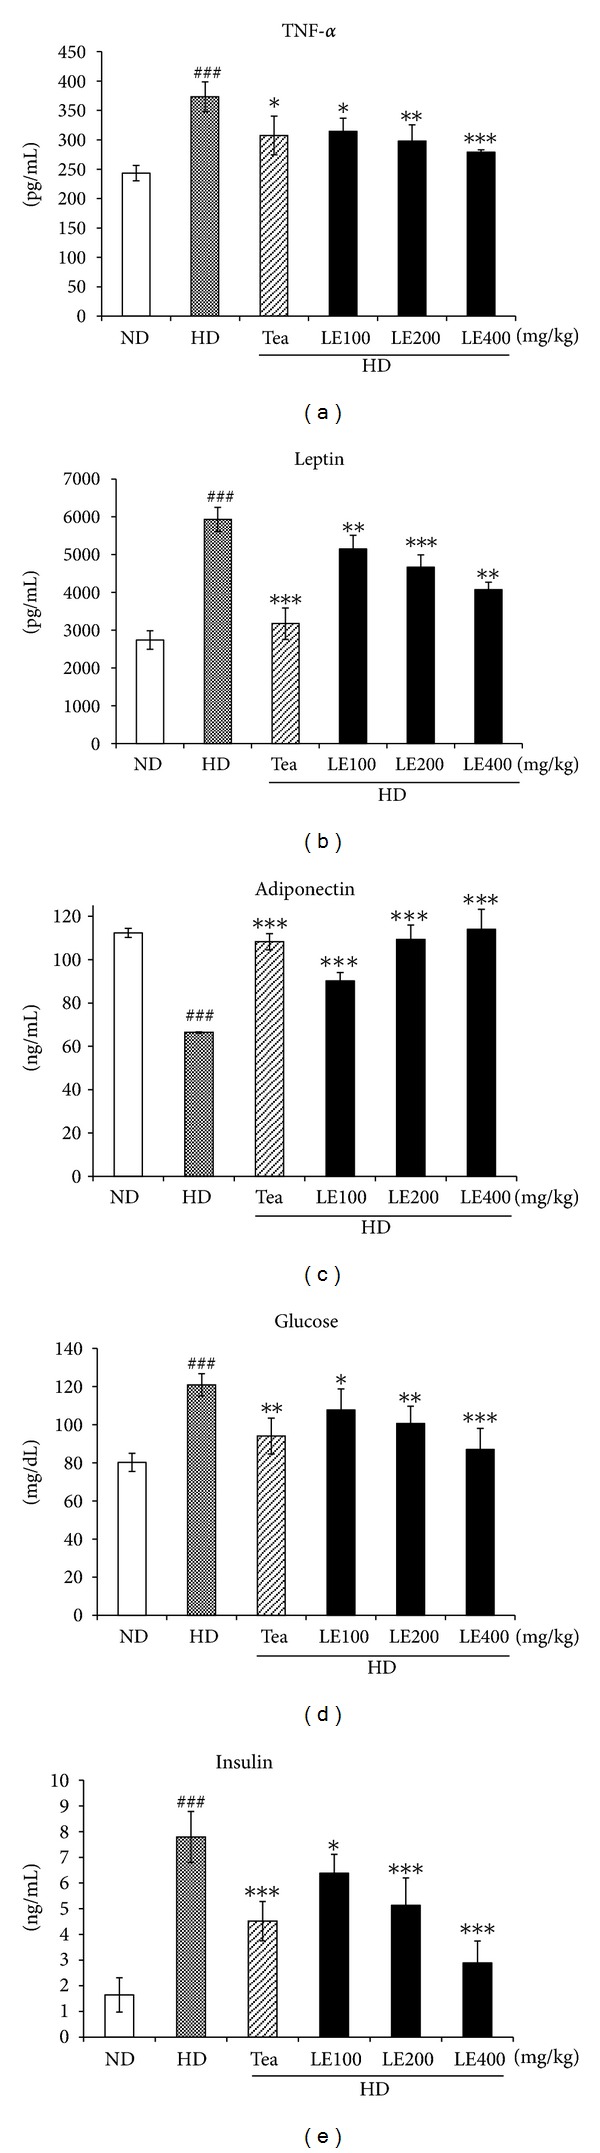
Effect of LE on the level of tumor necrosis factor-α, leptin, adiponectin, glucose, and insulin in blood. Values are mean ± SD (n ≥ 8). ### P < .001 versus the ND group; *P < .05, **P < .01, ***P < .001 versus HD groups. ### P < .001 versus the ND group; *P < .05, **P < .01, ***P < .001 versus HD groups.