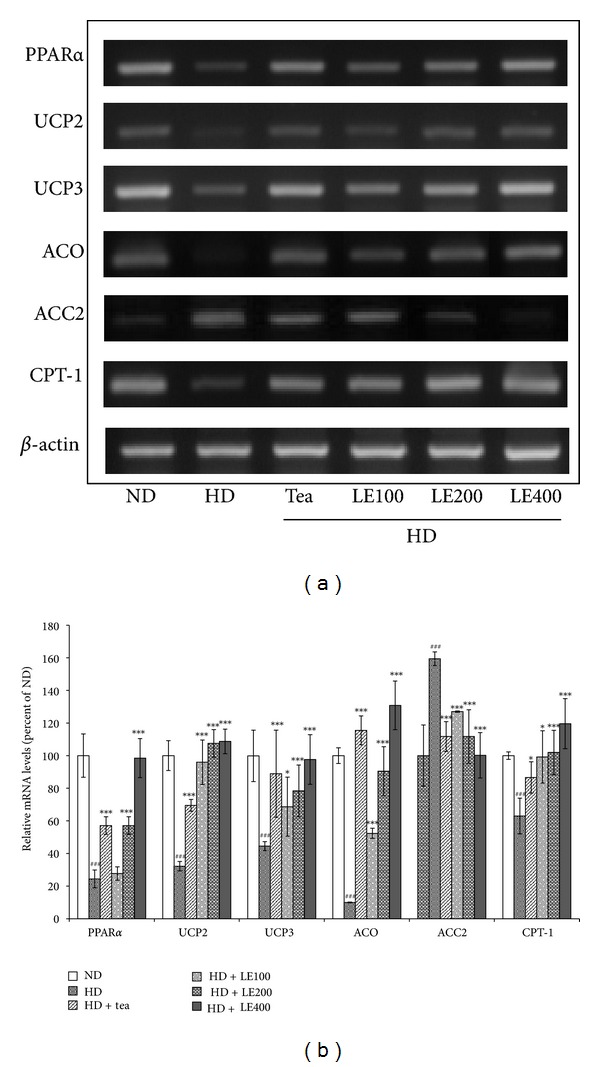
Figure 7.

Effect of LE on the gene expressions related to lipid metabolism in skeletal muscle. Rats were treated with LE or tea catechin for 6 weeks. The level of PPARα, UCP2, UCP3, ACO, ACC2, and CPT-1 mRNA was determined by RT-PCR analysis. Actin mRNA was used as an internal control. Relative fold intensities were analyzed using band densities obtained from RT-PCR. All RNA levels were normalized to that of actin mRNA. Results shown are mean and standard deviation (n ≥ 8). ### P < .001 versus the ND group; *P < .05, ***P < .001 versus HD groups.
