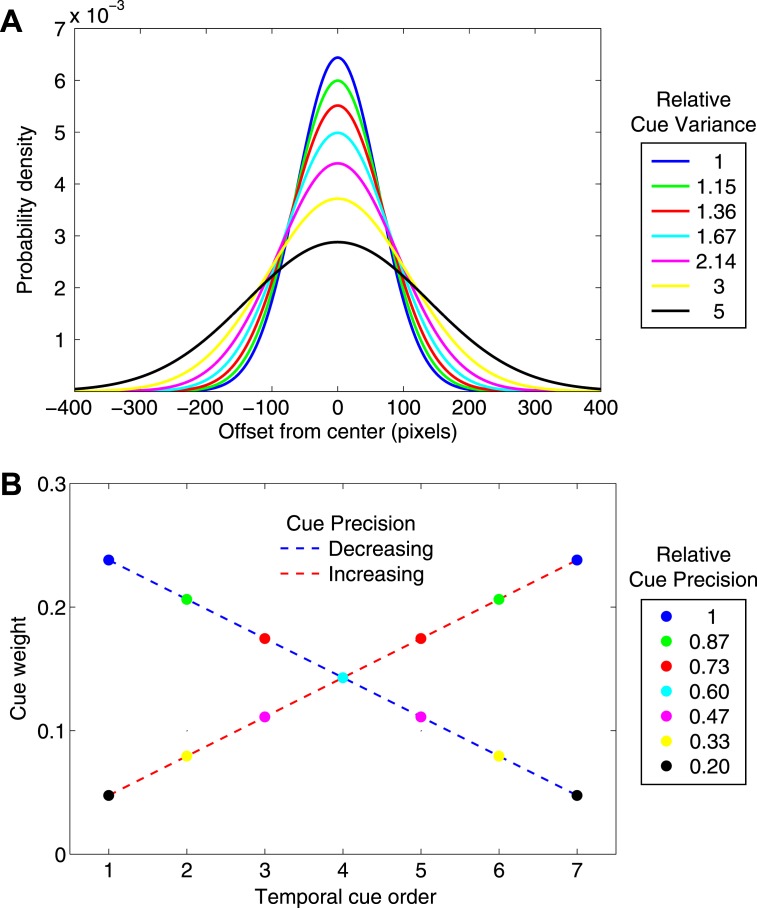
Figure 3.
Cue precisions and optimal weights. A. The seven cues were drawn from seven different Gaussians centered on the hidden target. The probability density functions of the seven Gaussians are plotted, coded in color. The legend specifies the relative variances of the seven distributions. B. The optimal weight of each cue is proportional to its precision (reciprocal of variance). In one condition the cues were presented in order of decreasing precision, in the other, in order of increasing precision. We plot optimal cue weights versus temporal position for both conditions of the experiment. The color codes agree with those in panel A. The cue precisions and consequent variances were chosen so that the cue weights decreased and increased linearly.

