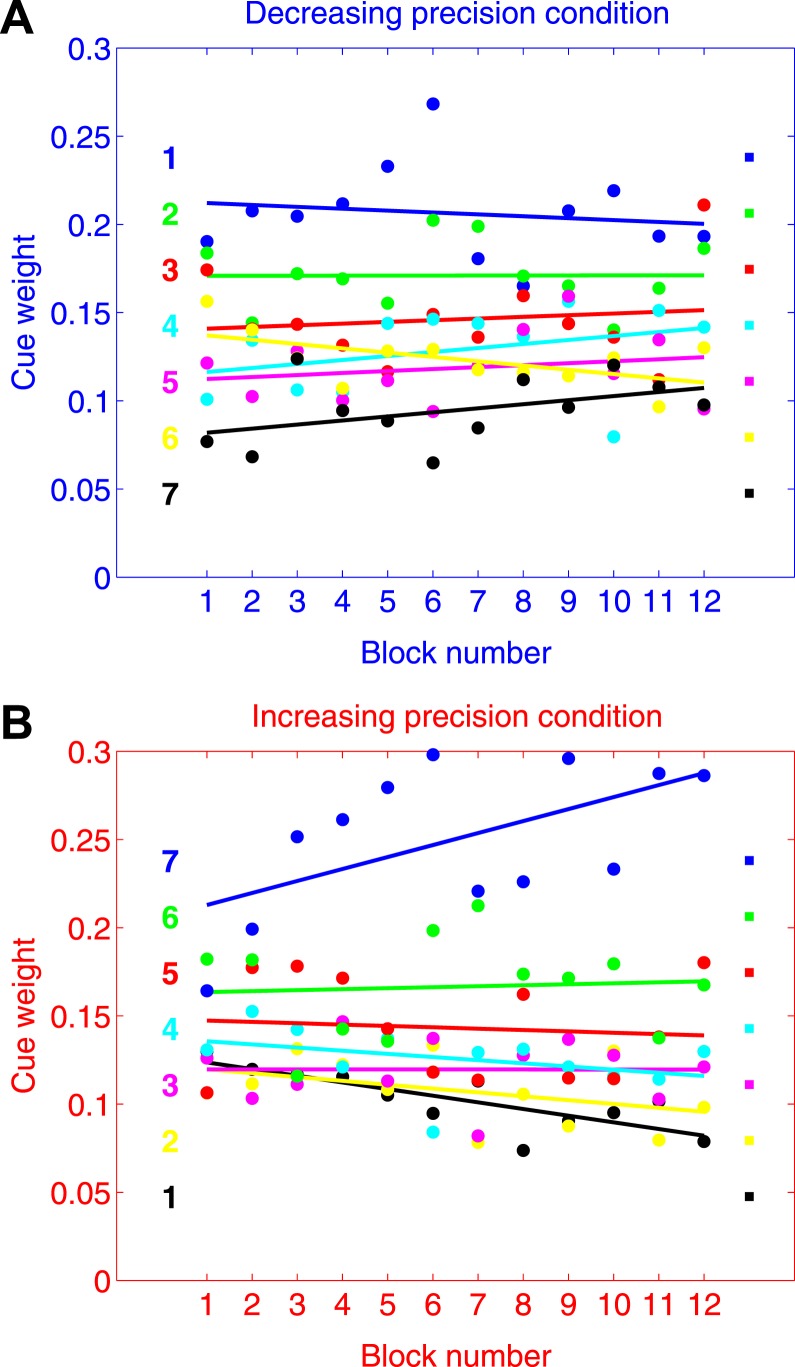
Figure 4.
Blocked analysis of cue weights (group results). A. Results for the decreasing precision condition in non-overlapping blocks of 50 trials. B. Results for the increasing precision condition in non-overlapping blocks of 50 trials. The color-coding of the seven cues follows the color scheme in Figure 3. The blue cue is the most precise one, followed by the next most precise cue in green, and so on. For reference, we placed colored squares on the right of each plot to mark the optimal weights of the cues. On the left of each plot we placed colored numerals indicating the presentation order of the cues.

