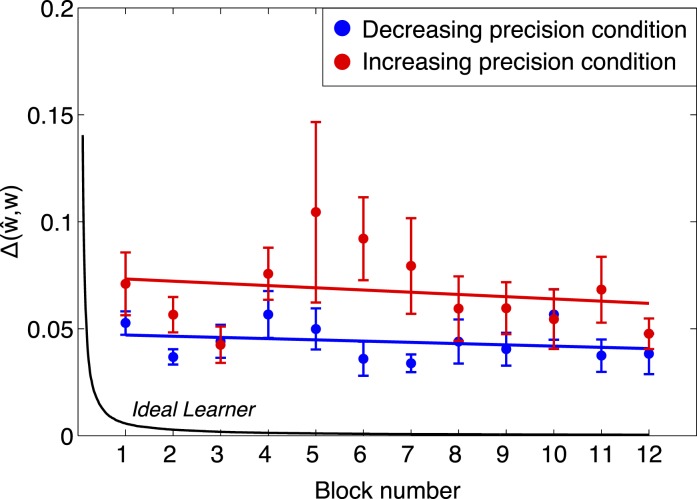
Figure 5.
Comparing trends in cue weights across time to ideal (group results). We plot the sum of the squared difference between estimated and ideal weights Δ(ŵ,w) versus block number for the decreasing precision condition (blue) and for the increasing precision condition (red). The values are averaged across observers and the error bars mark ± SEM. The black curve shows the expected convergence for an ideal learner (see text). Human performance is far from ideal even after 600 trials, and shows only a slight, non-significant trend toward convergence.

