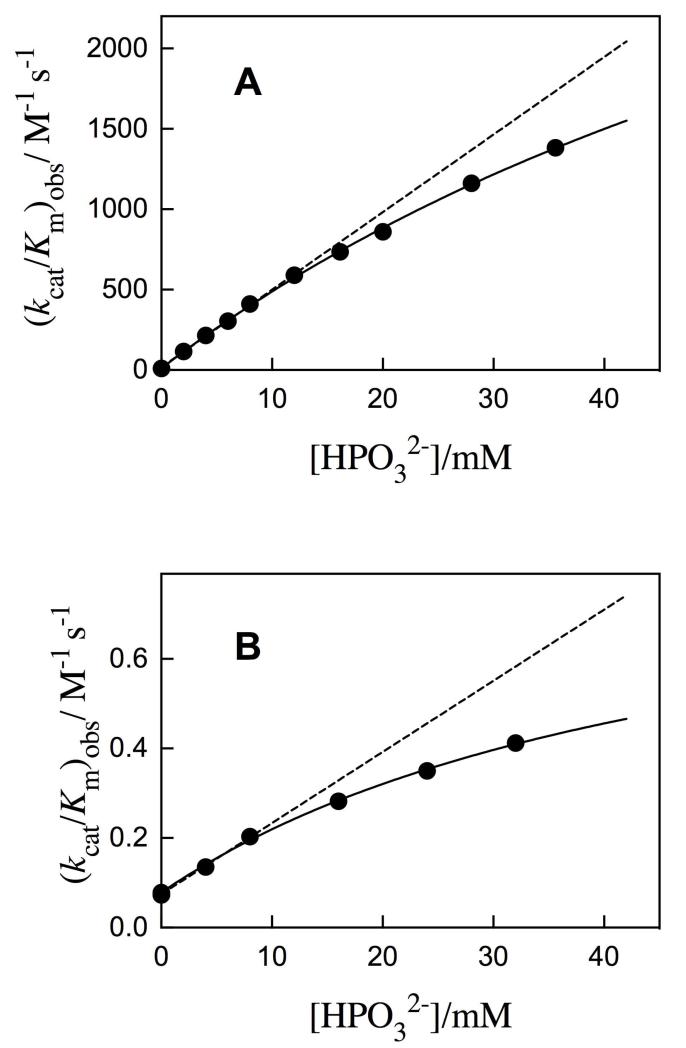
Figure 1.
Dependence of the observed second-order rate constant for the yeast OMPDC-catalyzed decarboxylation of truncated substrates on the concentration of added phosphite dianion at pH 7.0, 25 °C and I = 0.14 (NaCl). A. Decarboxylation of FEO. The solid line shows the fit of the data to eq 1, derived for Scheme 4, with (kcat/Km)E = 10 M−1 s−1 and Kd = 0.1 M. The dashed line is the linear correlation at [HPO32−] ≤ 12 mM, the slope of which gives the third-order rate constant (kcat/Km)E·HPi/Kd = 4.8 × 10⁴ M−2 s−1. B. Decarboxylation of 5′-dFO. The solid line shows the fit of the data to eq 1 with (kcat/Km)E = 0.078 M−1 s−1 and Kd = 0.05 M. The dashed line is the linear correlation at [HPO32−] ≤ 8 mM, the slope of which gives the third-order rate constant (kcat/Km)E·HPi/Kd = 16 M−2 s−1.

