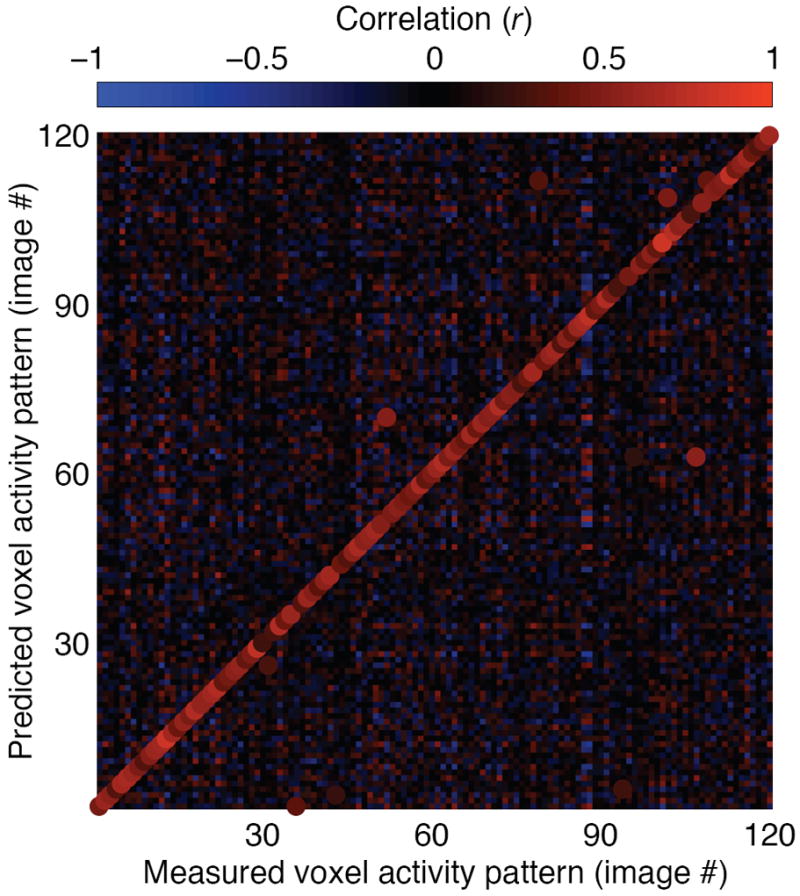
Fig. 3. Identification performance.

In the image identification stage of the experiment, fMRI data were recorded while each subject viewed 120 novel natural images that had not been used to estimate the receptive field models. For each of the 120 measured voxel activity patterns we attempted to identify which image had been seen. This figure illustrates identification performance for one subject (S1). The color at the mth column and nth row represents the correlation between the measured voxel activity pattern for the mth image and the predicted voxel activity pattern for the nth image. The highest correlation in each column is designated by an enlarged dot of the appropriate color, and indicates the image selected by the identification algorithm. For this subject 92% (110/120) of the images were identified correctly.
