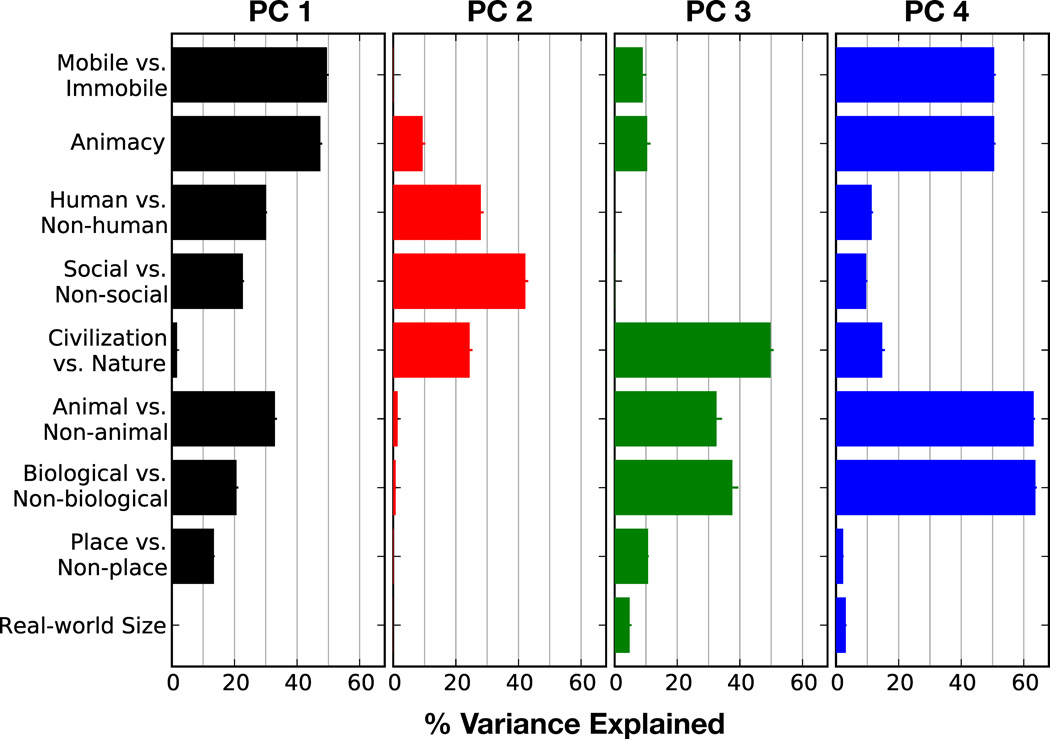
Figure 6.
Comparison between the group semantic space and nine hypothesized semantic dimensions. For each hypothesized semantic dimension we assigned a value to each of the 1705 categories (see methods for details) and we computed the fraction of variance that each dimension explains in each PC. Each panel shows the variance explained by all hypothesized dimensions in one of the four group PCs. Error bars indicate bootstrap standard error. The first PC is best explained by a dimension that contrasts mobile categories (people, non-human animals, and vehicles) with non-mobile categories, and an animacy dimension (Connolly et al, 2012) that assigns high weight to humans, decreasing weights to other mammals, birds, reptiles, fish, and invertebrates and zero weight to other categories. The second PC is best explained by a dimension that contrasts social categories (people and communication verbs) with all other categories. The third PC is best explained by a dimension that contrasts categories associated with civilization (people, man-made objects, and vehicles) with categories associated with nature (non-human animals). The fourth PC is best explained by a dimension that contrasts biological categories (people, animals, plants, body parts, plant parts) with non-biological categories, and a dimension that contrasts animals (people and non-human animals) with non-animals.

